STAAR Algebra I Released Tests
Welcome to Our Site
I greet you this day,
These are the solutions to the State of Texas Assessments of Academic Readiness (STAAR®) Algebra I Released
Tests as provided by the Texas Education Agency (TEA) website.
If you find these resources valuable and if any of these resources were helpful in your passing the
STAAR Algebra I test, please consider making a donation:
Cash App: $ExamsSuccess or
cash.app/ExamsSuccess
PayPal: @ExamsSuccess or
PayPal.me/ExamsSuccess
Venmo: @ExamsSuccess or
Venmo.com/u/ExamsSuccess
Google charges me for the hosting of this website and my other
educational websites. It does not host any of the websites for free.
Besides, I spend a lot of time to type the questions and the solutions well.
As you probably know, I provide clear explanations on the solutions.
Your donation is appreciated.
Comments, ideas, areas of improvement, questions, and constructive
criticisms are welcome.
Feel free to contact me. Please be positive in your message.
I wish you the best.
Thank you.
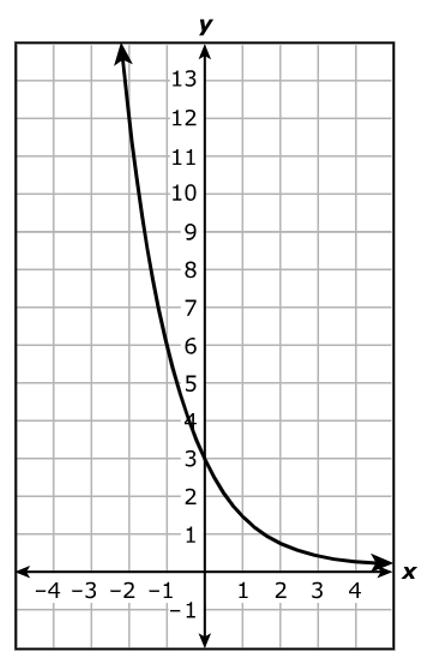
Which statement is best represented by the graph of the function?
A. The equation of the asymptote of the graph is x = 4
B. The function is increasing on the interval x > 0 and decreasing on the interval x < 0
C. The x-intercept of the graph of the function is (8, 0)
D. The y-intercept of the graph of the function is (0, 3)
The y-intercept is the point where the graph intersects the y-axis.
The graph intersects the y-axis at (0, 3)
Hence, the y-intercept is (0, 3)
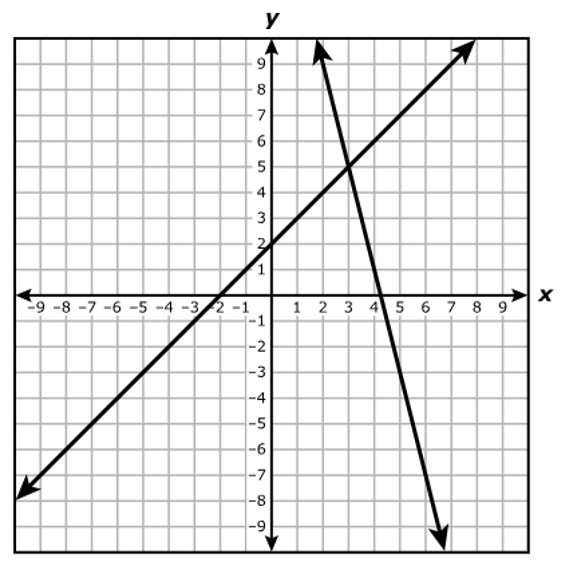
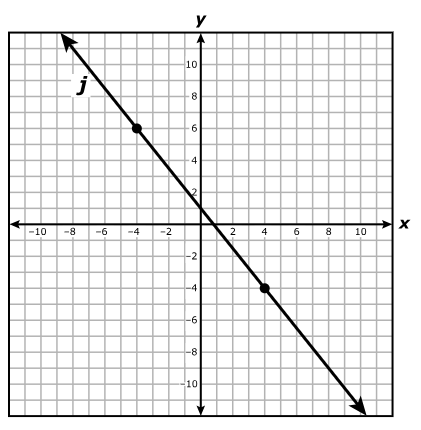
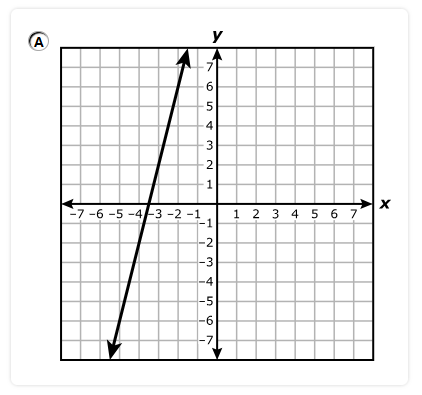
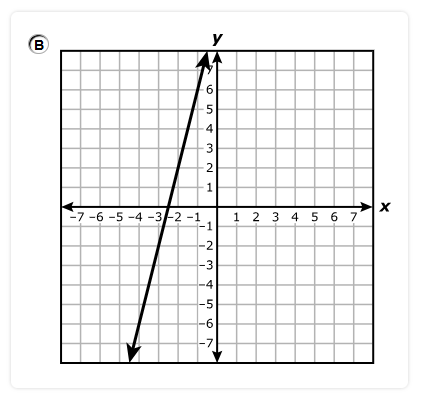
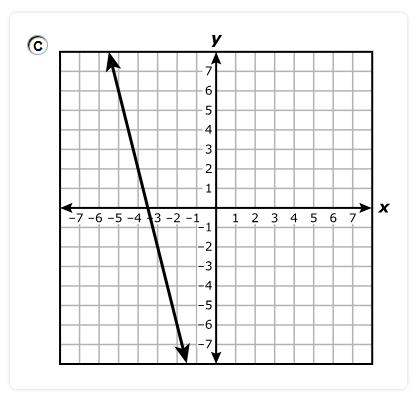
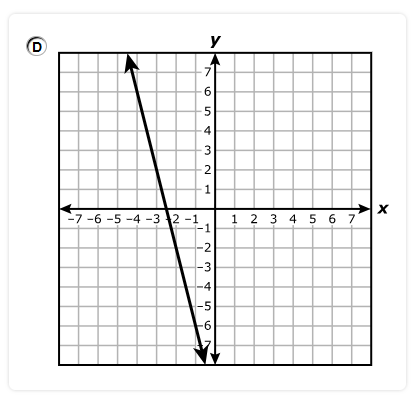
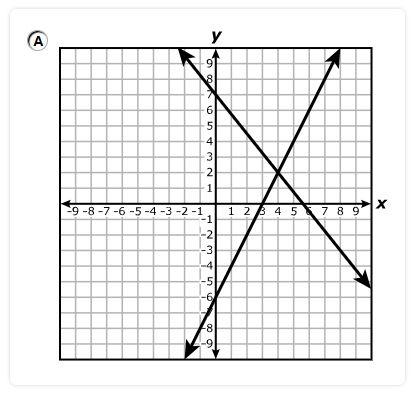
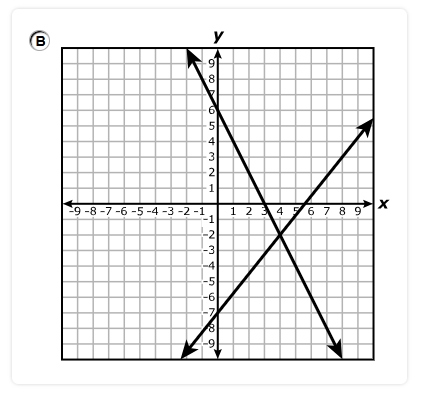
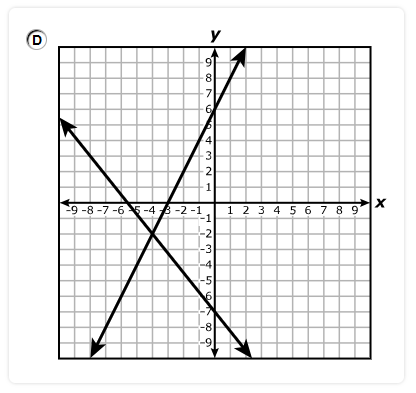
Which system of equations best represents the system shown on the graph?
$ A.\;\; y = x + 2 \\[3ex] \hspace{1.6em} y = -4x + 17 \\[5ex] B.\;\; y = x + 2 \\[3ex] \hspace{1.6em} y = -4x + 15 \\[5ex] C.\;\; x + y = 2 \\[3ex] \hspace{1.6em} 4x + y = 17 \\[5ex] D.\;\; x + y = 2 \\[3ex] \hspace{1.6em} 4x + y = 15 \\[3ex] $
$ m = \text{slope} \\[3ex] b = y-\text{intercept} \\[3ex] y - y_1 = m(x - x_1)...\text{Point–Slope Form} \\[3ex] y = mx + b ...\text{Slope–Intercept Form} \\[5ex] \underline{\text{Line with the positive slope}} \\[3ex] \text{Point 1: } (-2, 0) \\[3ex] x_1 = -2 \\[3ex] y_1 = 0 \\[5ex] \text{Point 2: } (0, 2) \\[3ex] x_2 = 0 \\[3ex] y_2 = 2 \\[5ex] m = \dfrac{y_2 - y_1}{x_2 - x_1} \\[5ex] m = \dfrac{2 - 0}{0 - (-2)} \\[5ex] m = \dfrac{2}{2} \\[5ex] m = 1 \\[5ex] \text{Point–Slope Form} \\[3ex] y - 0 = 1(x - (-2)) \\[5ex] \text{Slope–Intercept Form} \\[3ex] y = x + 2 \\[5ex] \underline{\text{Line with the negative slope}} \\[3ex] \text{Point 1: } (3, 5) \\[3ex] x_1 = 3 \\[3ex] y_1 = 5 \\[5ex] \text{Point 2: } (5, -3) \\[3ex] x_2 = 5 \\[3ex] y_2 = -3 \\[5ex] m = \dfrac{y_2 - y_1}{x_2 - x_1} \\[5ex] m = \dfrac{-3 - 5}{5 - 3} \\[5ex] m = -\dfrac{8}{2} \\[5ex] m = -4 \\[5ex] \text{Point–Slope Form} \\[3ex] y - 5 = -4(x - 3) \\[3ex] y = -4x + 12 + 5 \\[5ex] \text{Slope–Intercept Form} \\[3ex] y = -4x + 17 \\[5ex] \therefore \text{The system of equations shown on the graph is:} \\[3ex] y = x + 2 \\[3ex] y = -4x + 17 $
| x | f(x) |
|---|---|
| –6 | –10 |
| –2 | –4 |
| 4 | 5 |
| 10 | 14 |
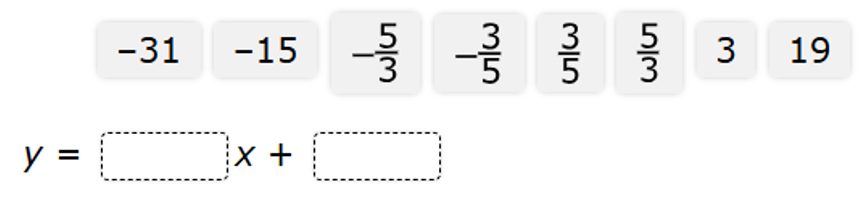
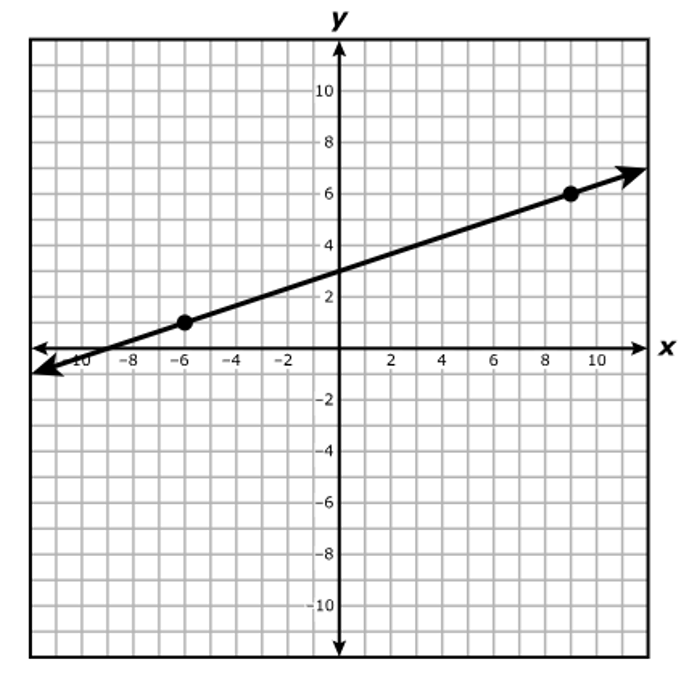
What is the equation of function f in slope–intercept form?
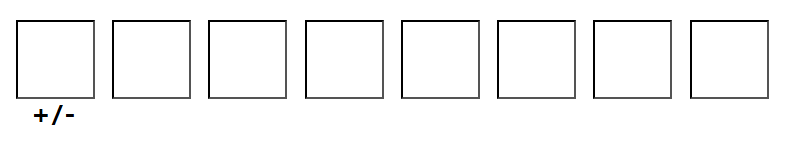
Move the correct answer to each box. Not all answers will be used.
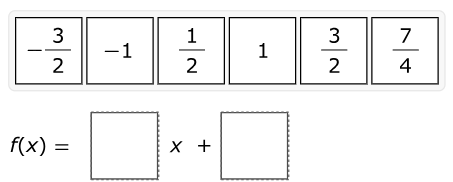
$ \text{Point 1: } (-6, -10) \\[3ex] x_1 = -6 \\[3ex] y_1 = -10 \\[5ex] \text{Point 2: } (10, 14) \\[3ex] x_2 = 10 \\[3ex] y_2 = 14 \\[5ex] \text{Slope, } m = \dfrac{y_2 - y_1}{x_2 - x_1} \\[5ex] m = \dfrac{14 - (-10)}{10 - (-6)} \\[5ex] m = \dfrac{24}{16} \\[5ex] m = \dfrac{3}{2} \\[5ex] \text{Point–Slope Form} \\[3ex] y - y_1 = m(x - x_1) \\[3ex] y - (-10) = \dfrac{3}{2}[x - (-6)] \\[5ex] y + 10 = \dfrac{3}{2}(x + 6) \\[5ex] y + 10 = \dfrac{3}{2}x + 9 \\[5ex] \text{Slope–Intercept Form} \\[3ex] y = mx + b ...\text{where } b \text{ is the y-intercept} \\[3ex] y = \dfrac{3}{2}x + 9 - 10 \\[5ex] y = \dfrac{3}{2}x + (-1) $
A.
B.
C.
D.
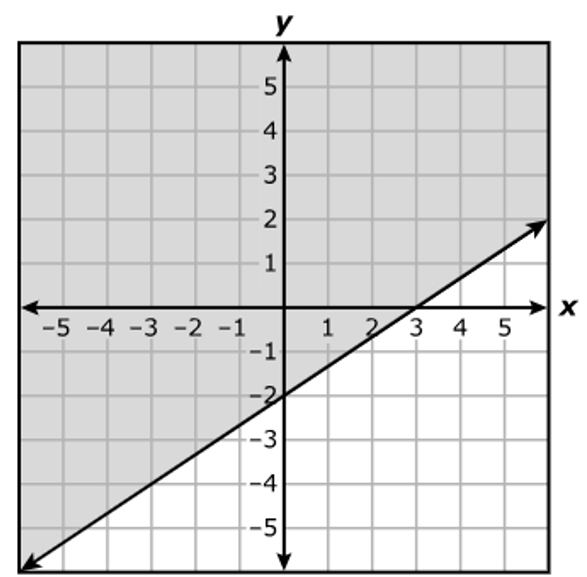
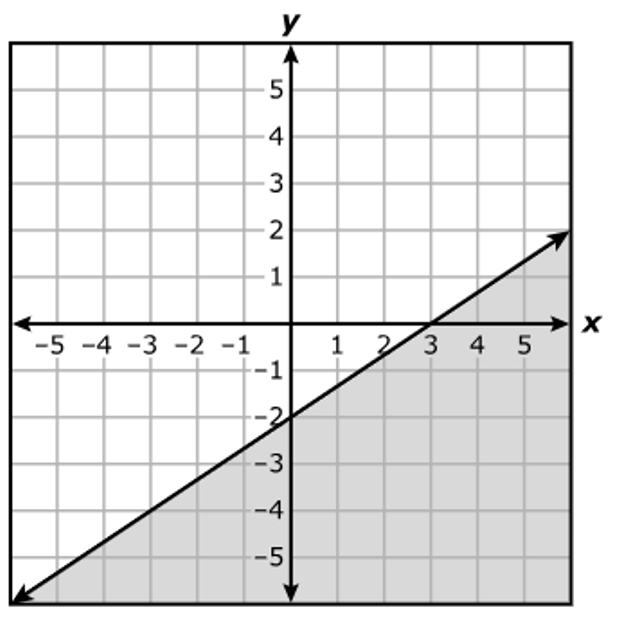
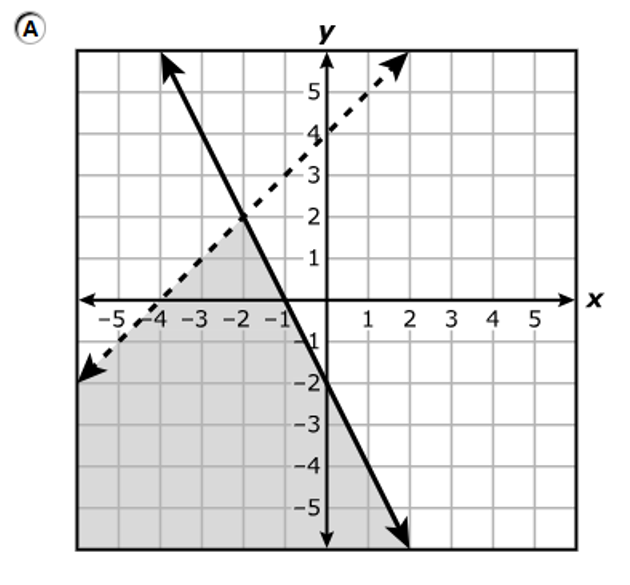
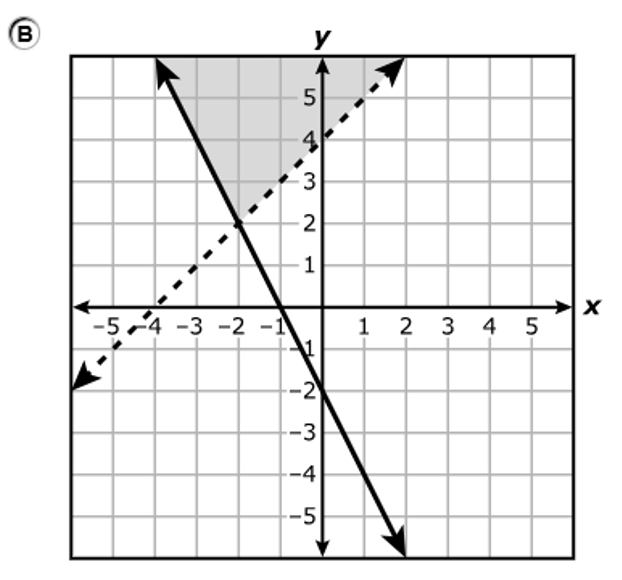
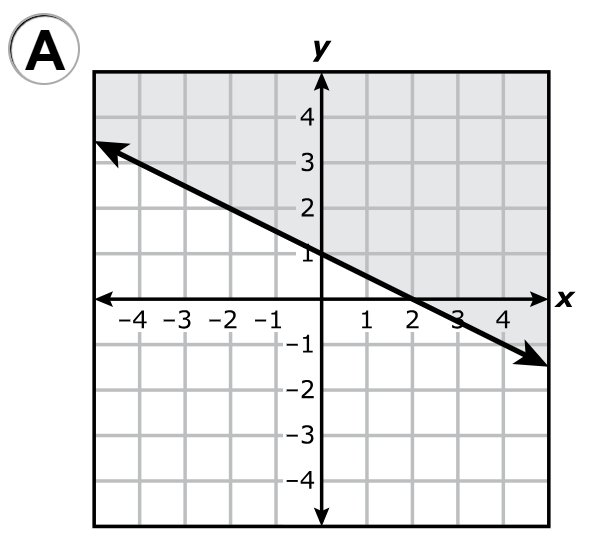
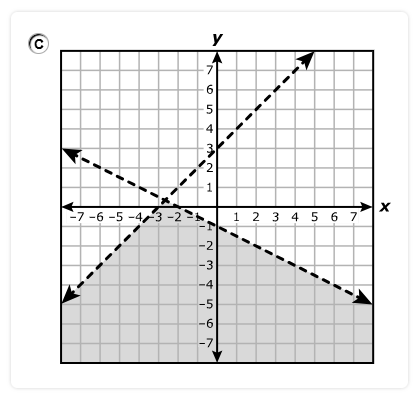
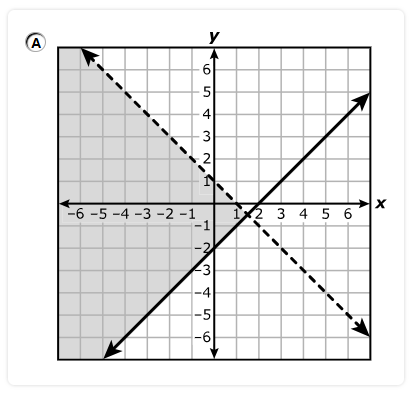
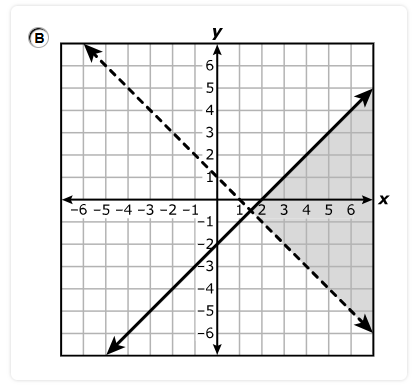
$ 3y - 2x \le -6 \\[5ex] \text{When } x = 0 \\[3ex] 3y - 2(0) \le -6 \\[3ex] 3y \le -6 \\[3ex] y \le -2 ...\text{Mark point } (0, -2) \\[3ex] \text{The shaded area is downwards from } y = -2 \\[5ex] \text{When } y = 0 \\[3ex] 3(0) - 2x \le -6 \\[3ex] -2x \le -6 \\[3ex] x \ge \dfrac{-6}{-2} \\[5ex] x \ge 3 ...\text{Mark point } (3, 0) \\[3ex] \text{The shaded area is to the right of } x = 3 \\[3ex] $ Draw a straight solid line (because of the equal sign) connecting the two points: (0, –2) and (3, 0)
Shade the regions accordingly.
Locate the overlap of the two regions.
The correct answer is Option B.
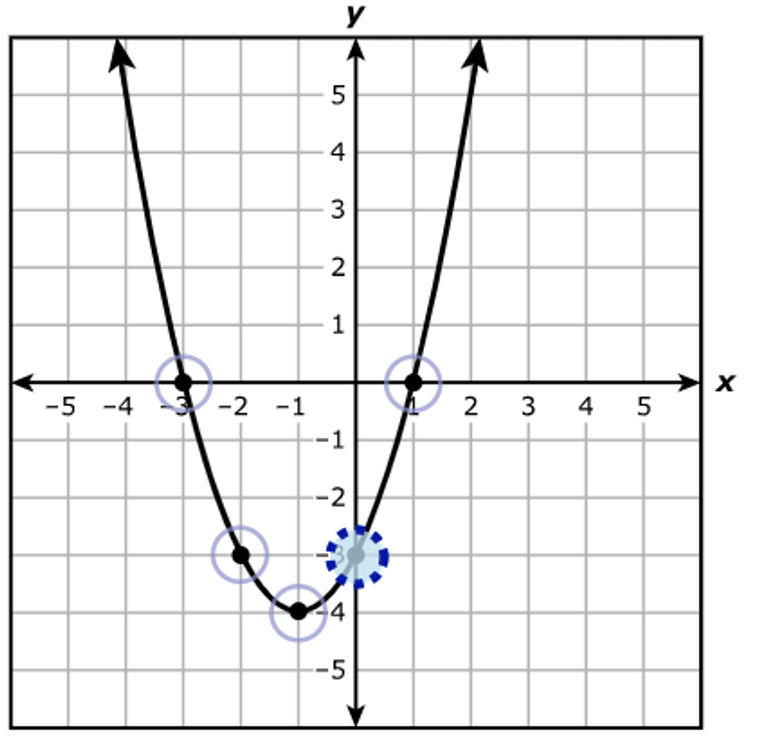
Which location best represents the y-intercept of the function?
Select ONE correct answer.
The y-intercept is the point where the graph intersects the y-axis.
The correct location is:
Enter your answer in the box provided.
$ f(x) = 3(x - 4)^2 - 7 \\[3ex] f(-1) = 3(-1 - 4)^2 - 7 \\[3ex] = 3(-5)^2 - 7 \\[3ex] = 3(25) - 7 \\[3ex] = 75 - 7 \\[3ex] = 68 $
Which value best represents the zero of the function? $ A.\;\; 2 \\[3ex] B.\;\; 10 \\[3ex] C.\;\; -5 \\[3ex] D.\;\; -2 \\[3ex] $
The function is the y
The zero of the function is the value of the x when y = 0
y = 0 when x = –5
Hence, the zero of the function is: x = –5
Which equation represents the axis of symmetry of the graph of f? $ A.\;\; x = -5 \\[3ex] B.\;\; x = -3 \\[3ex] C.\;\; y = -7 \\[3ex] D.\;\; y = 2 \\[3ex] $
The axis of symmetry of the graph of f is the vertical line through the vertex
It is the x-coordinate of the vertex
Axis of symmetry is: $x = -5$
Line p is parallel to line n and passes through the point (15, –6)
What is the equation of line p in slope–intercept form?
Move the correct answer to each box.
Each answer may be used more than once.
Not all answers will be used.
$ \underline{\text{Line }n} \\[3ex] y = -\dfrac{3}{5}x + 6 \\[5ex] \text{Compare to slope–intercept form: } y = mx + b \\[3ex] \text{slope, } m = -\dfrac{3}{5} \\[5ex] \underline{\text{Line }p} \\[3ex] m = -\dfrac{3}{5} ...\text{parallel lines have the same slope} \\[5ex] \text{Passes through Point } (15, -6) \\[3ex] x_1 = 15 \\[3ex] y_1 = -6 \\[3ex] y - y_1 = m(x - x_1) ...\text{Point–Slope Form} \\[3ex] y - (-6) = -\dfrac{3}{5}(x - 15) \\[5ex] y + 6 = -\dfrac{3}{5}x + 9 \\[5ex] y = -\dfrac{3}{5}x + 9 - 6 \\[5ex] y = -\dfrac{3}{5}x + 3 ...\text{Slope–Intercept Form} $
Move the correct answer to each box.
Each amswer may be used more than once.
Not all answers will be used.
$ \dfrac{2x^{12}}{6x^{-3}} \\[5ex] \dfrac{2}{6} * \dfrac{x^{12}}{x^{-3}} \\[5ex] \dfrac{2}{6} * x^{12 - (-3)}...\text{Law 2 Exp} \\[5ex] \dfrac{1}{3} * x^{12 + 3} \\[5ex] \dfrac{1}{3}x^{15} $
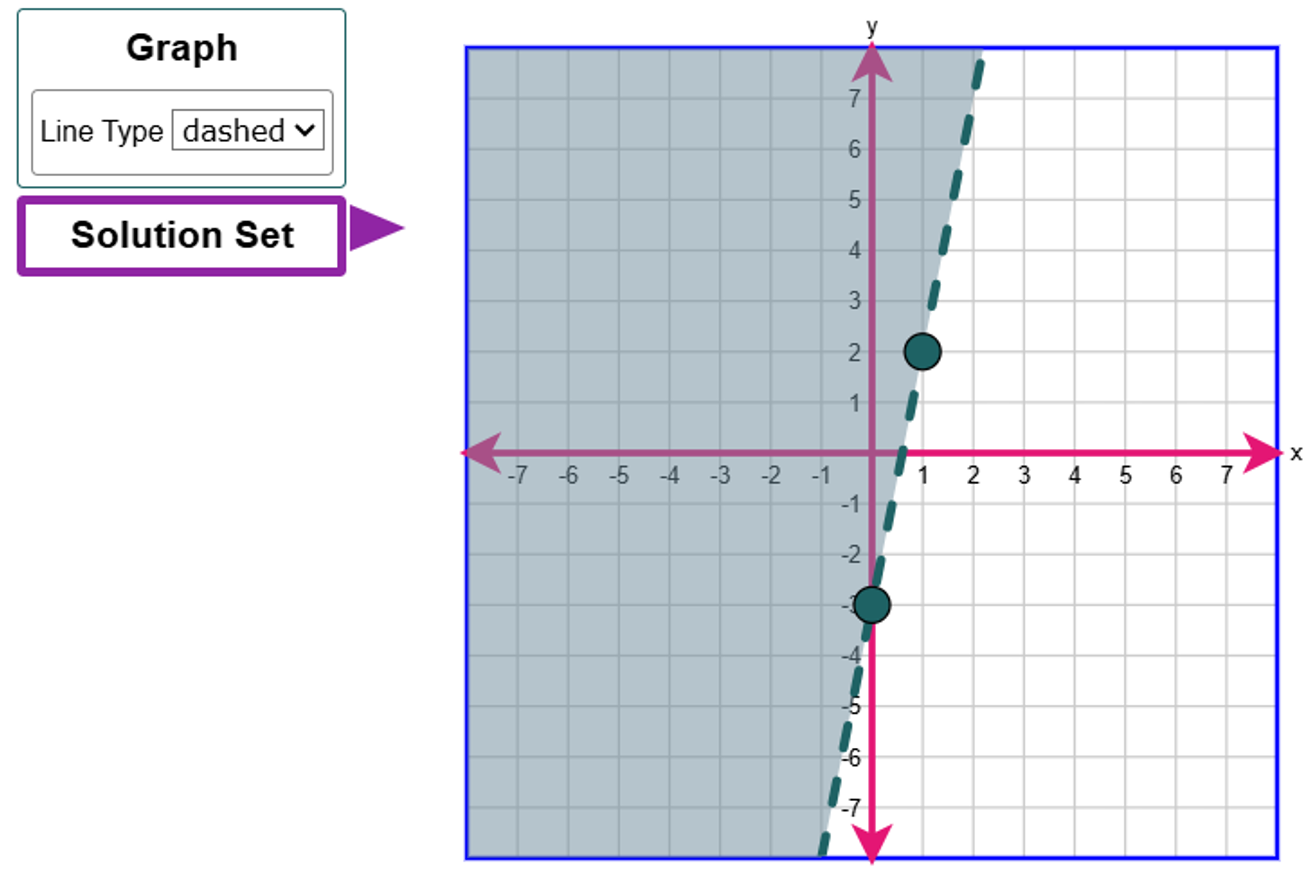
Graph the solution set of the linear inequality in the coordinate plane.
First, select the Graph button to graph the line and choose the line style.
To graph a line, select two points in the coordinate plane. A line will connect the points.
Then, select the Solution Set button to slect the desired region.
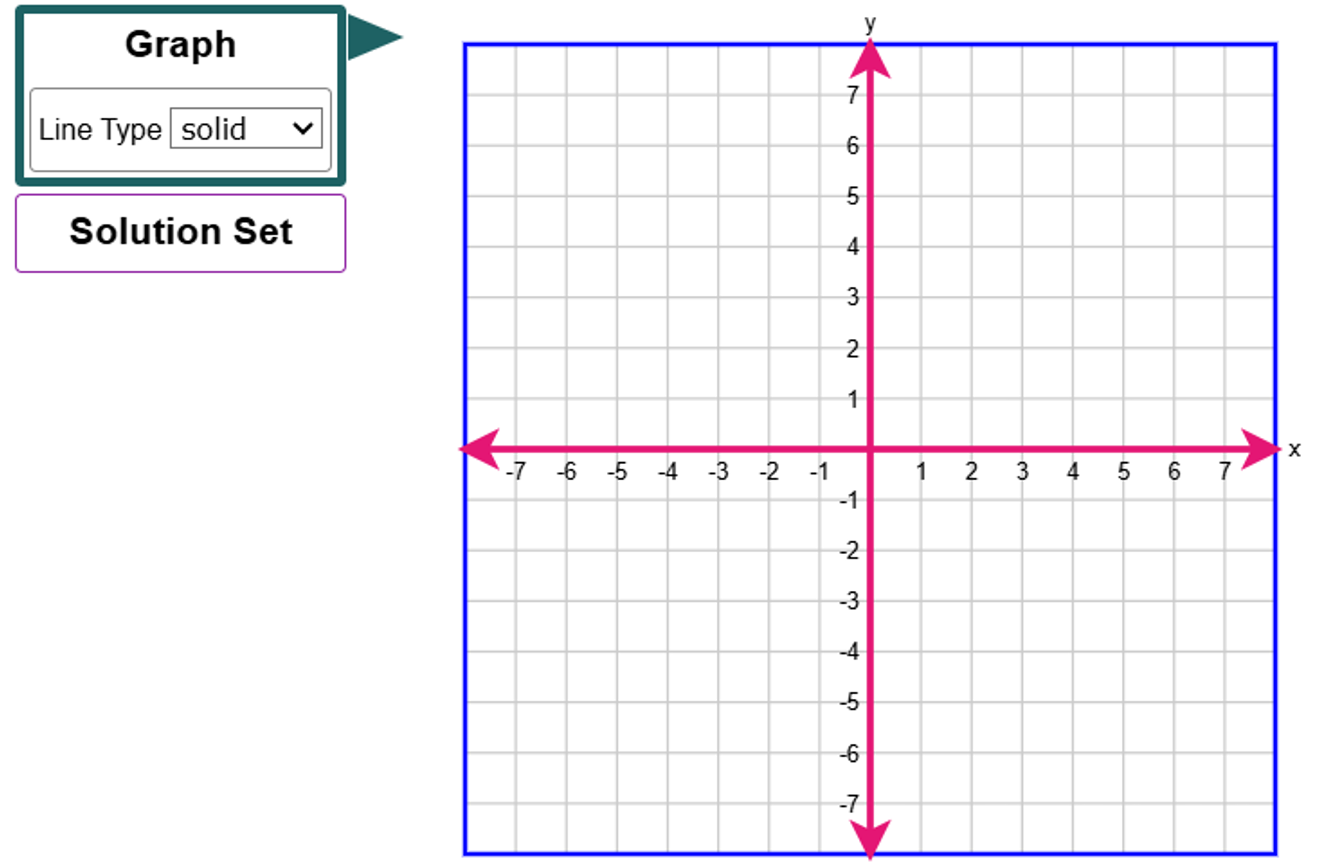
Because the inequality does not contain an equal sign, the line will be a dashed line.
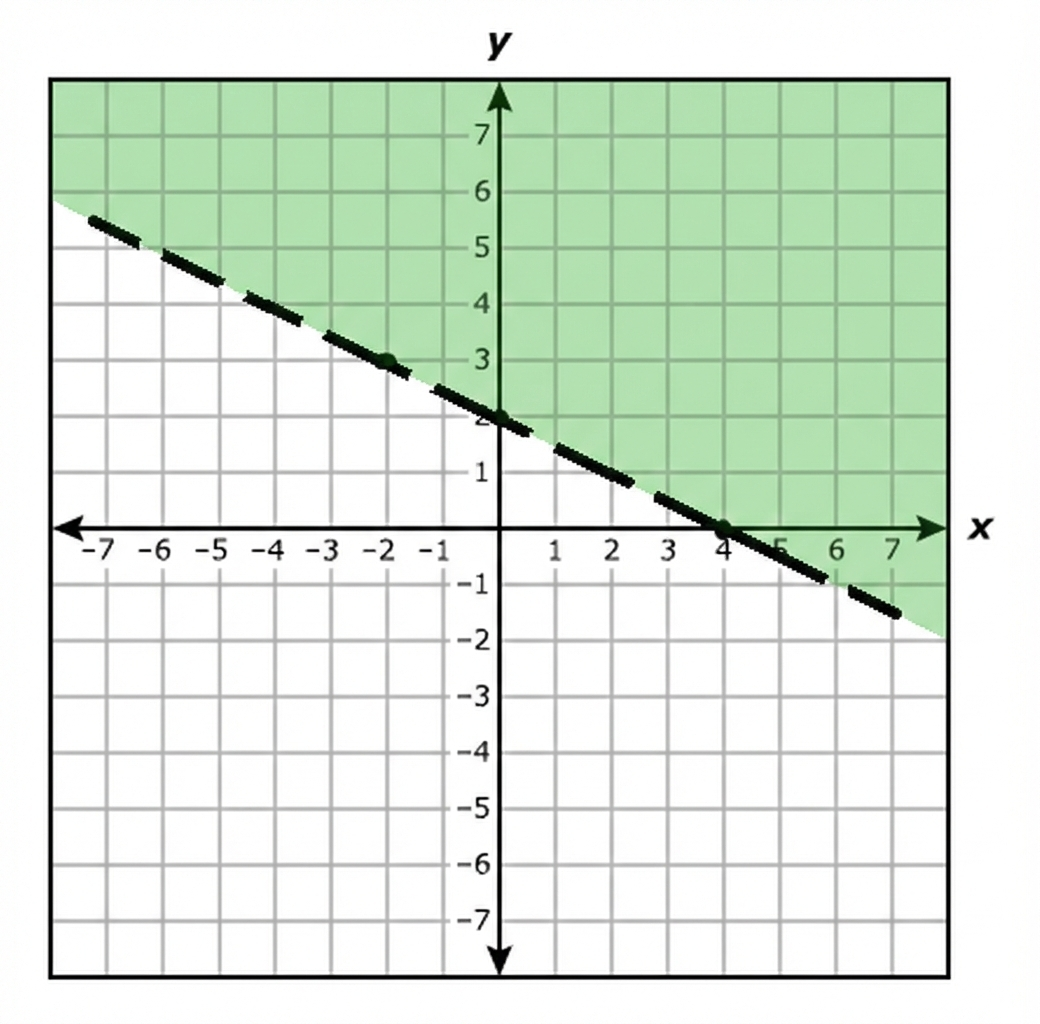
$ y \gt 5x - 3 \\[5ex] \text{When } x = 0 \\[3ex] y \gt 5(0) - 3 \\[3ex] y \gt -3 \\[5ex] \text{When } x = 1 \\[3ex] y \gt 5(1) - 3 \\[3ex] y \gt 5 - 3 \\[3ex] y \gt 2 \\[5ex] $ The graph of the inequality is
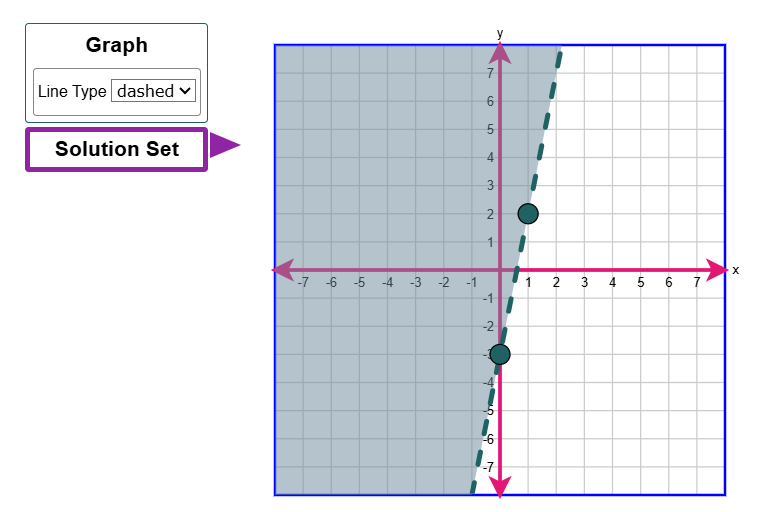
If you want to play with this some more, we can also use another approach.
$ \text{When } y = 2 \\[3ex] 2 \gt 5x - 3 \\[3ex] 5x - 3 \lt 2 \\[3ex] 5x \lt 2 + 3 \\[3ex] 5x \lt 5 \\[3ex] x \lt 1 \\[3ex] $ Student: Mr. C, wait a minute.
Why did you not do when $y = 0$?
Is there any reason for using 2?
Teacher: Good observation.
If we used 0, we would end up with a fraction.
Fractions are not allowed in the graph that we are given.
Hence, it is necessary that we use a value of $y$ that will give an integer value of $x$ within the domain [-7, 7]
What other values could we have used?
Student: 7
–2
Teacher: There you go...
The graph of the inequality is
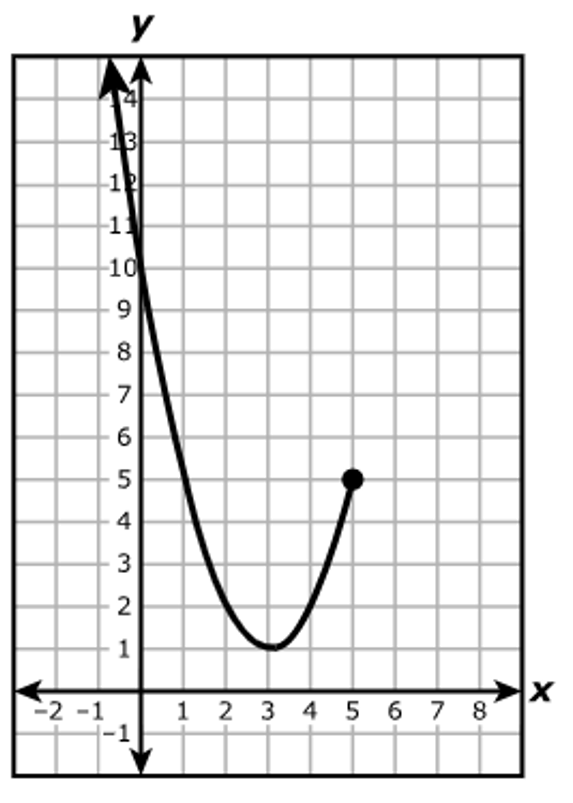
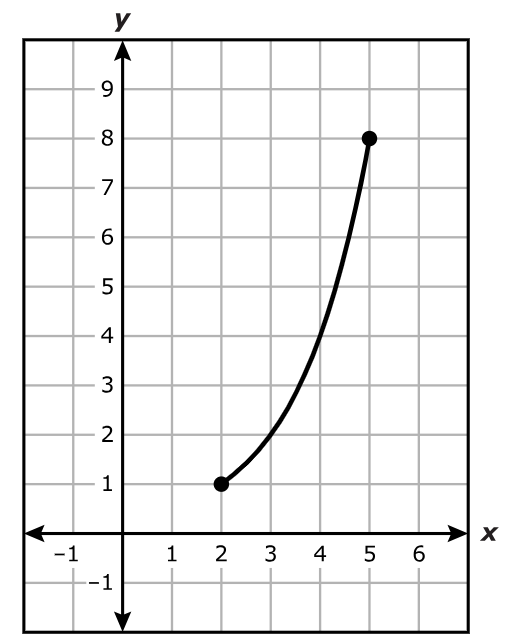
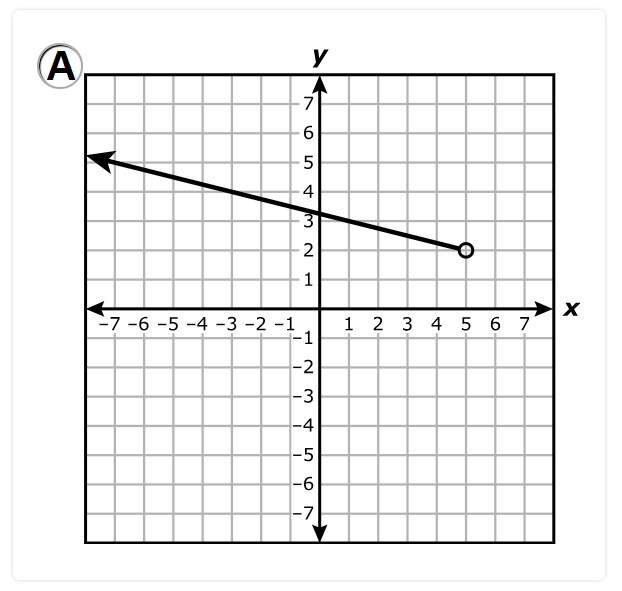
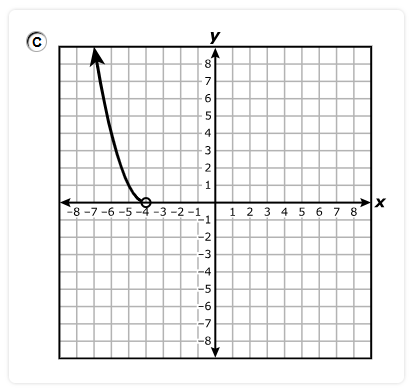
Which statement best represents the domain of the part of the function shown?
A. All real numbers less than or equal to 5
B. All real numbers greater than or equal to 3
C. All real numbers greater than or equal to 1
D. All real numbers
The domain is the set of all the input values, x for which the function has an output.
The closed circle represents a closed interval. It shows that the end point is included.
On the graph, it is on the right hand side at x = 5
The arrow represents infinity
On the graph, it is on the left hand side and represents negative infinity.
So, the interval notation is: $(-\infty, 5]$
This represents all real numbers less than or equal to 5.
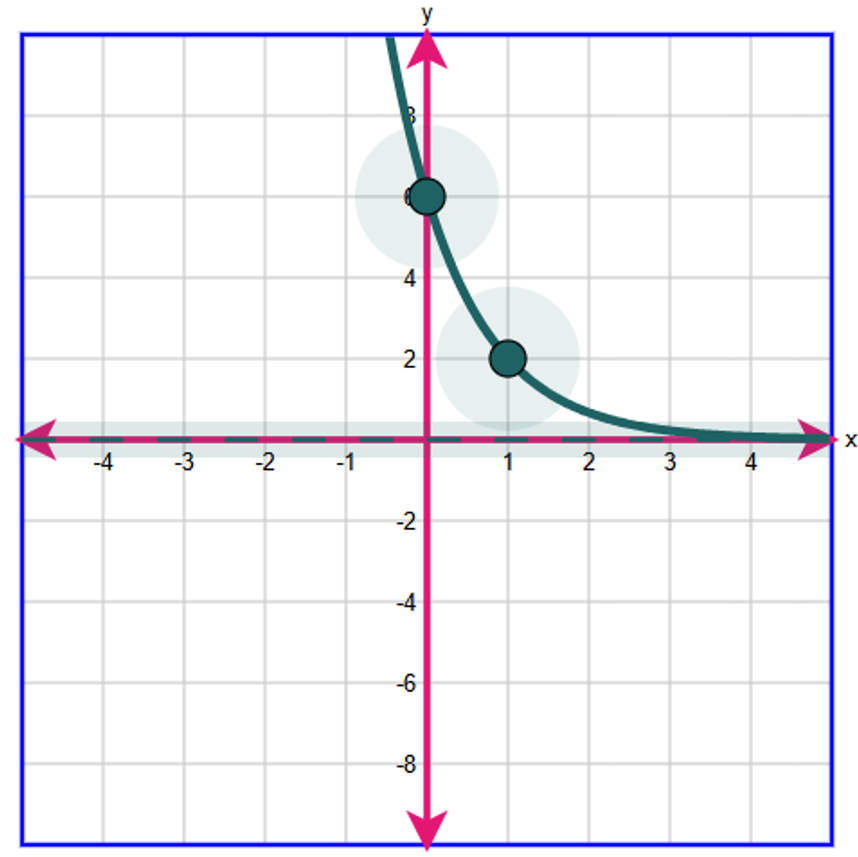
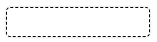
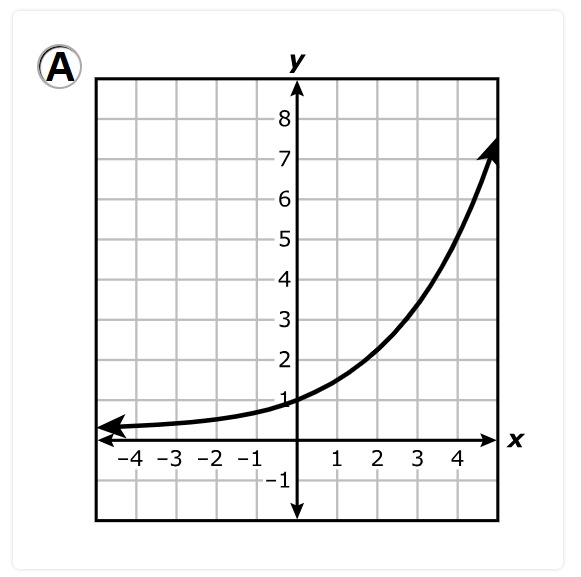
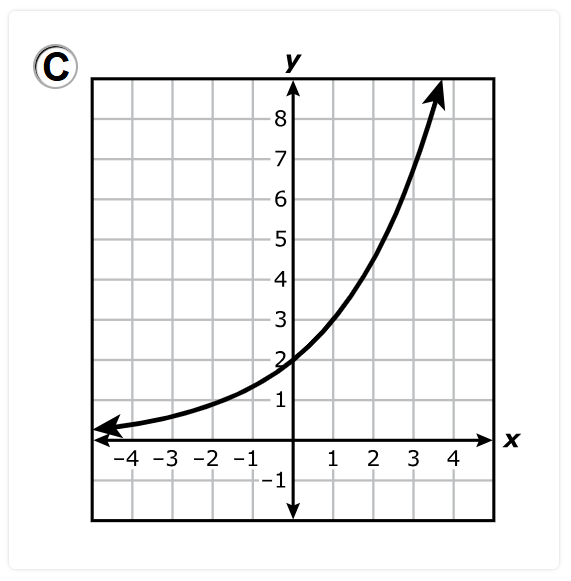
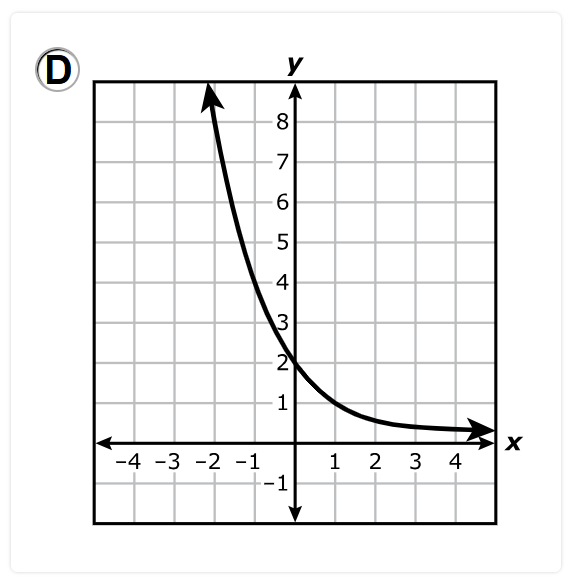
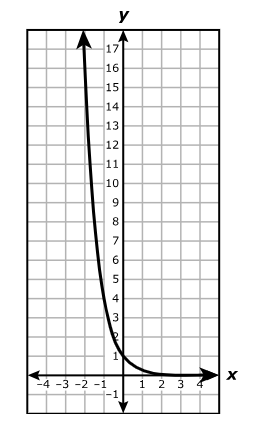
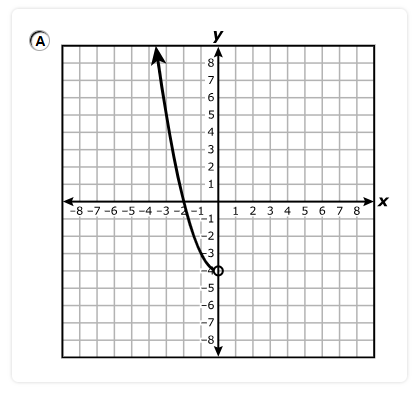
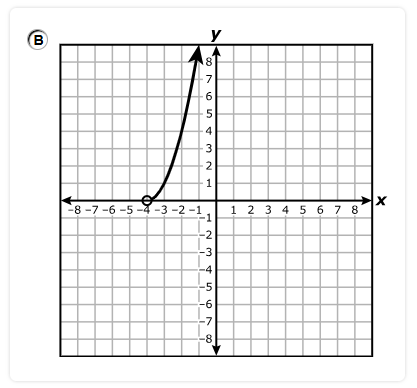
Select the type of graph.
Drag the two points and the asymptote, if applicable, to their correct positions.
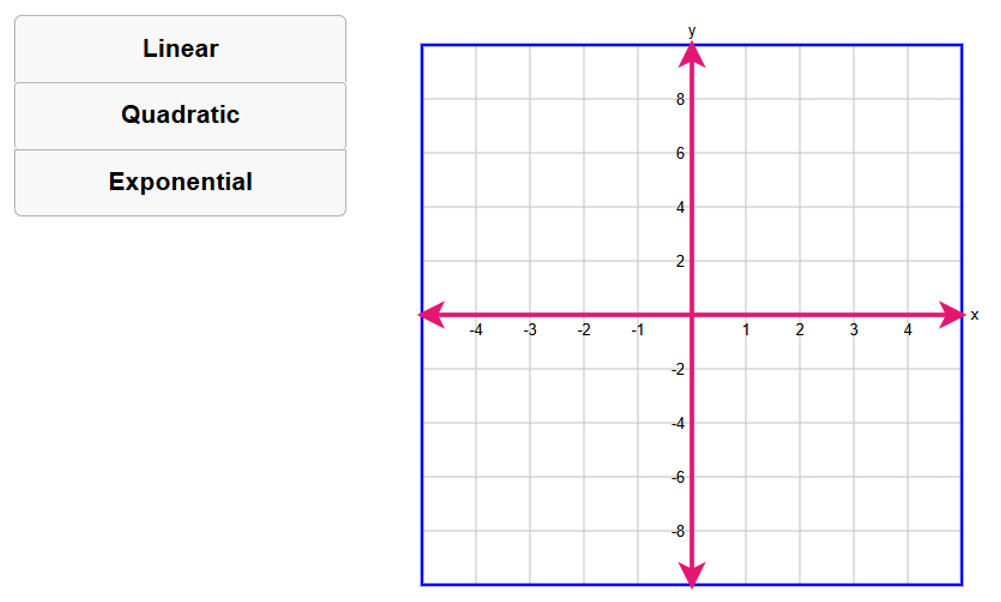
The function is an exponential function because the exponent, x is a variable and the base, $\dfrac{1}{3}$ is a constant.
So, we select the Exponential tool.
$ y = f(x) = 6\left(\dfrac{1}{3}\right)^x \\[5ex] \text{ When } x = 0 \\[3ex] y = 6\left(\dfrac{1}{3}\right)^0 \\[5ex] y = 6 * 1 \\[3ex] y = 6 \\[3ex] \text{Point 1: } (0, 6) \\[5ex] \text{ When } x = 1 \\[3ex] y = 6\left(\dfrac{1}{3}\right)^1 \\[5ex] y = 6 * \dfrac{1}{3} \\[5ex] y = 2 \\[3ex] \text{Point 2: } (1, 2) \\[3ex] $ The graph of the exponential function is:
A.
B.
C.
D.
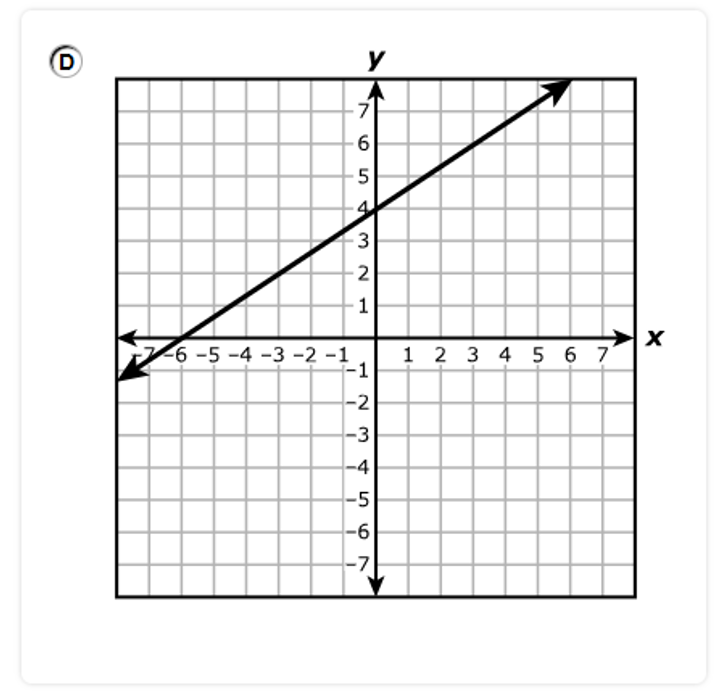
The graph has a positive slope.
So, Options A. and B. are discarded.
The graph has a y-intercept of 4
This implies that the graph intersects the y-axis at 4.
Option C is eliminated.
Option D. is the correct answer.
Move the correct answer to each box.
Not all answers will be used.
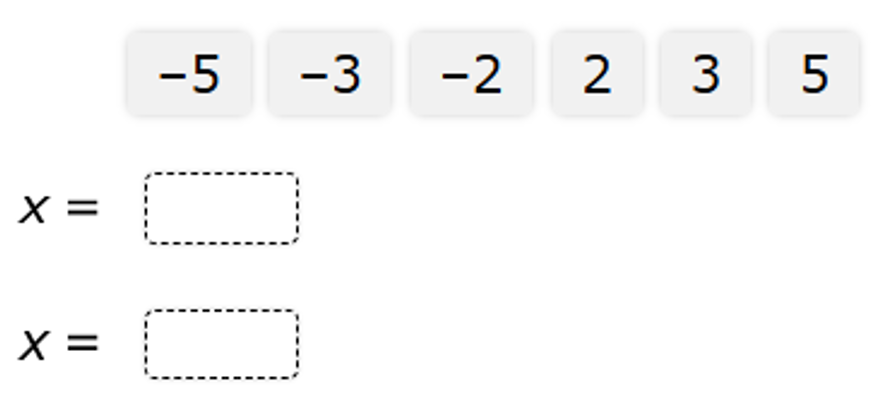
$ (2x + 1)^2 = 25 \\[3ex] 2x + 1 = \pm\sqrt{25} ...\text{Square Root Property} \\[3ex] 2x + 1 = \pm 5 \\[3ex] 2x = -1 \pm 5 \\[3ex] 2x = -1 + 5 \hspace{2em}\text{OR}\hspace{2em} 2x = -1 - 5 \\[3ex] 2x = 4 \hspace{2em}\text{OR}\hspace{2em} 2x = -6 \\[3ex] x = \dfrac{4}{2} \hspace{2em}\text{OR}\hspace{2em} x = -\dfrac{6}{2} \\[5ex] x = 2 \hspace{2em}\text{OR}\hspace{2em} x = -3 $
For accounting purposes the owner idenitifed a constant depreciation on the value of the van.
The graph shows the linear relationship between y, the value in dollars of the delivery van, and x, the time in years.
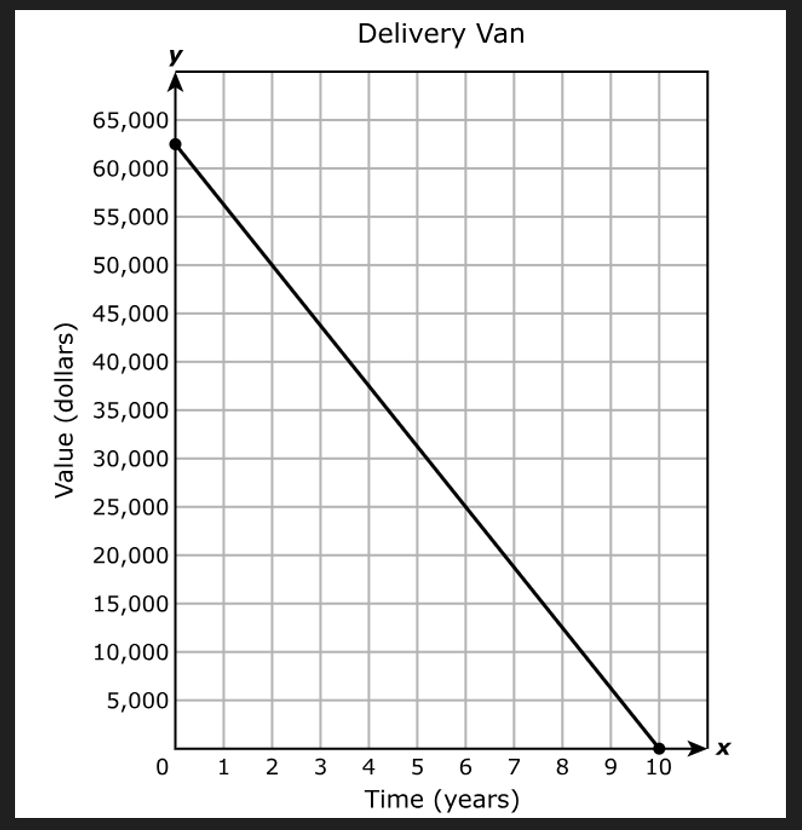
Which inequality best represents the domain of the function for this situation?
$ A.\;\; 0 \le y \le 10 \\[3ex] B.\;\; 0 \le x \le 10 \\[3ex] C.\;\; 0 \le y \le 62,500 \\[3ex] D.\;\; 0 \le x \le 62,500 \\[3ex] $
The domain is the set of all the input values, x for which the function has an output.
The closed circle represents a closed interval. It shows that the endpoint is included.
On the graph:
The closed circle on the left hand side is at x = 0
The closed circle on the right hand side is at x = 10
The interval notation is: [0, 10]
The set notation is: Domain = $\{x: 0 \le x \le 10 \}$
B.
C.
D.
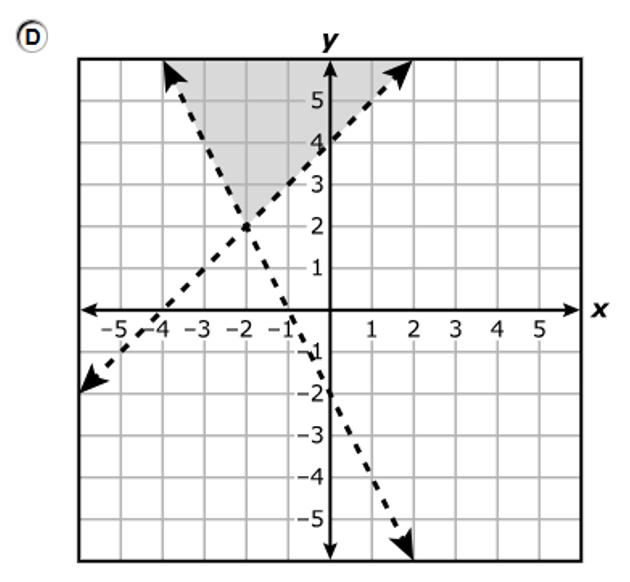
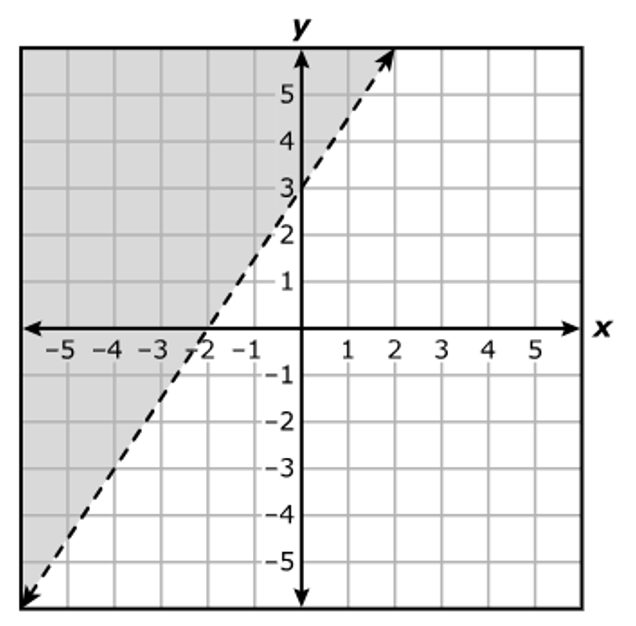
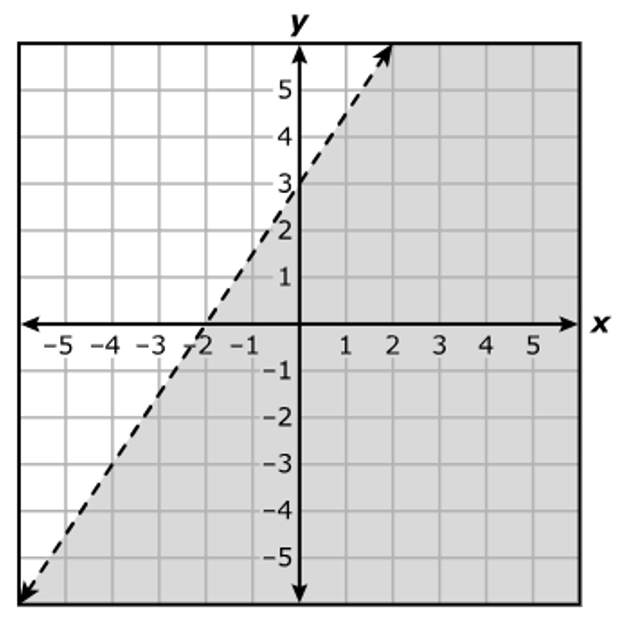
$ \underline{\text{Inequality 1}} \\[3ex] \text{This is a dashed line because of the absence of the equality sign} \\[3ex] y \lt x + 4 \\[3ex] \text{When } x = 0 \\[3ex] y \lt 0 + 4 \\[3ex] y \lt 4 \\[3ex] \text{When } y = 0 \\[3ex] 0 \lt x + 4 \\[3ex] x + 4 \gt 0 \\[3ex] x \gt 0 - 4 \\[3ex] x \gt -4 \\[5ex] \underline{\text{Inequality 2}} \\[3ex] \text{This is a solid line because of the presence of the equality sign} \\[3ex] y \le -2x - 2 \\[3ex] \text{When } x = 0 \\[3ex] y \le -2(0) - 2 \\[3ex] y \le 0 - 2 \\[3ex] y \le -2 \\[3ex] \text{When } y = 0 \\[3ex] 0 \le -2x - 2 \\[3ex] -2x - 2 \ge 0 \\[3ex] -2x \ge 0 + 2 \\[3ex] -2x \ge 2 \\[3ex] x \le \dfrac{2}{-2} \\[5ex] x \le -1 \\[3ex] $ To graph a system of inequalities, each inequality is shaded and the solution is where the shaded regions overlap.

Choose the correct answer from each drop-down menu to complete the sentence.
The graph of f is translated 6 units
 and 2 units
  to create the graph of function g.
$ f(x) = x^2 \\[3ex] g(x) = f(x - 6) + 2 \\[3ex] = (x - 6)^2 ...\text{Horizontal Shift 6 units right} \\[3ex] + 2 ...\text{Vertical Shift 2 units up} \\[3ex] $
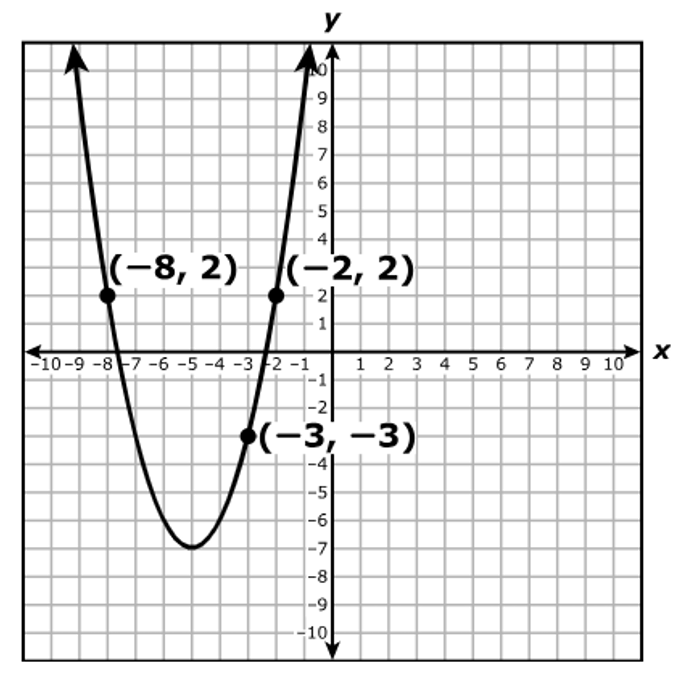
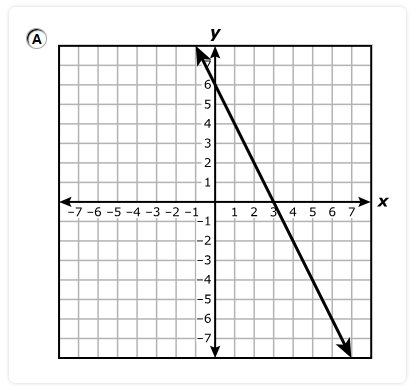
Which equation is best represented by this graph?
$ A.\;\; y = 3(x + 1) \\[3ex] B.\;\; y = 3(x + 3) \\[3ex] C.\;\; y = \dfrac{1}{3}(x + 9) \\[5ex] D.\;\; y = \dfrac{1}{3}(x + 3) \\[5ex] $
$ \text{Point 1: } (-6, 1) \\[3ex] x_1 = -6 \\[3ex] y_1 = 1 \\[5ex] \text{Point 2: } (9, 6) \\[3ex] x_2 = 9 \\[3ex] y_2 = 6 \\[5ex] \text{Slope, } m = \dfrac{y_2 - y_1}{x_2 - x_1} \\[5ex] m = \dfrac{6 - 1}{9 - (-6)} \\[5ex] m = \dfrac{5}{15} \\[5ex] m = \dfrac{1}{3} \\[5ex] \text{Point–Slope Form} \\[3ex] y - y_1 = m(x - x_1) \\[3ex] y - 1 = \dfrac{1}{3}[x - (-6)] \\[5ex] y - 1 = \dfrac{1}{3}(x + 6) \\[5ex] \text{Simplify} \\[3ex] y - 1 = \dfrac{1}{3}x + 2 \\[5ex] y = \dfrac{1}{3}x + 2 + 1 \\[5ex] y = \dfrac{1}{3}x + 3 \\[5ex] y = \dfrac{1}{3}(x + 9) $
Which statement is true about this system of equations?
A. There are infinitely many solutions.
B. The only solution is (–8, 5).
C. The only solution is (5, –8).
D. There is no solution.
$ x + y = -8...eqn.(1) \\[3ex] 2x + 2y = 10...eqn.(2) \\[3ex] \text{From } eqn.(2) \\[3ex] 2(x + y) = 10 \\[3ex] x + y = \dfrac{10}{2} \\[5ex] x + y = 5 ...\text{modified form of } eqn.(2) \\[3ex] $ We notice that eqn.(1) and eqn.(2) are the same on the Left Hand Side (LHS) but give different results on the Right Hand Side (RHS).
This is an inconsistent system.
Hence, the system has no solution.
Choose the correct answer from each drop-down menu to complete the sentences.
The initial population of the town in 2010 was
 .
. The population is
 at a rate of
  per year.
$ \underline{\text{Exponential Function}} \\[3ex] y = ab^x \\[3ex] a = \text{initial value} \\[3ex] b = \text{base} \\[5ex] \underline{\text{Exponential Decay Function}} \\[3ex] \text{This is because } 0.85 \lt 1 \\[3ex] y = a(1 - r)^x \\[3ex] r = \text{decay rate} \\[5ex] \underline{\text{Compare}} \\[3ex] P(t) = 26,080(0.85)^t \\[3ex] \text{initial population} = 26080 \text{ people} \\[3ex] 1 - r = 0.85 \\[3ex] 1 - 0.85 = r \\[3ex] r = 0.15 \\[3ex] r = 0.15 * 100 = 15\% \\[3ex] $ The population is decreasing at a rate of 15% per year.
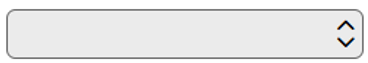
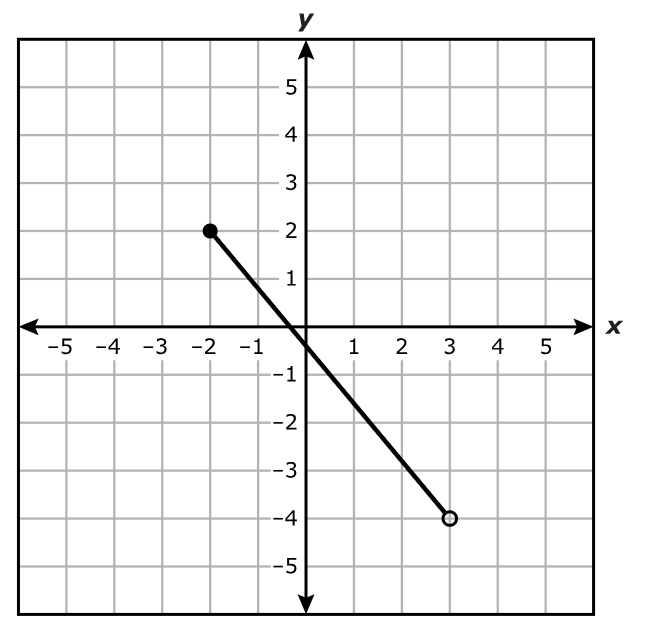
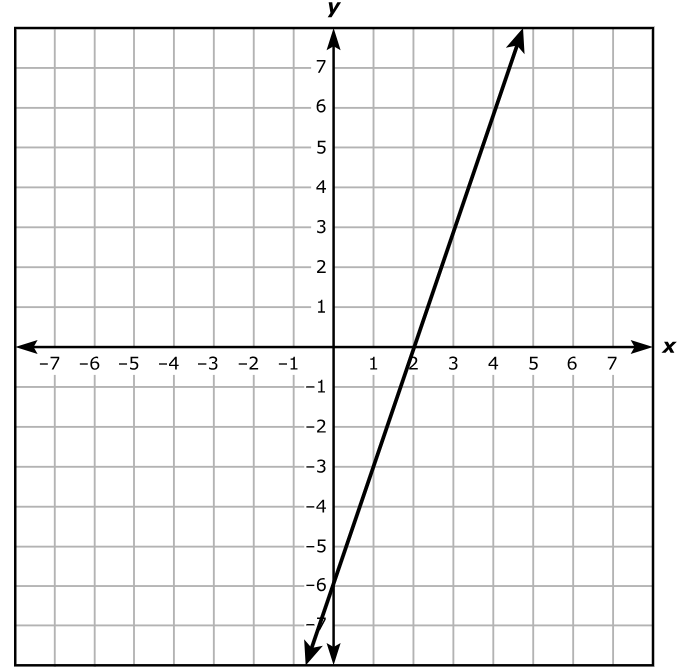
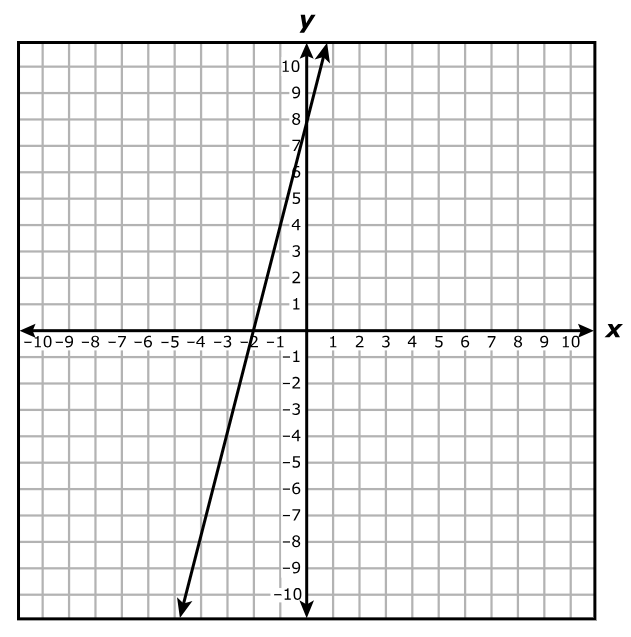
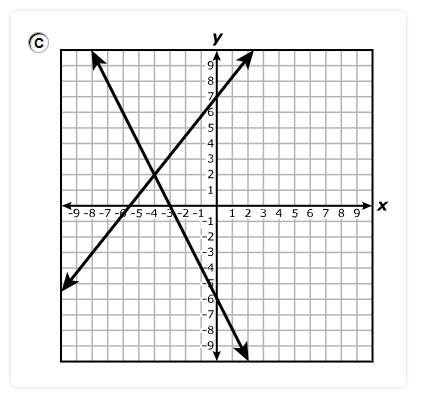
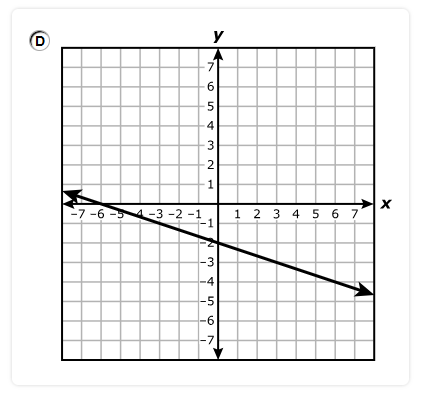
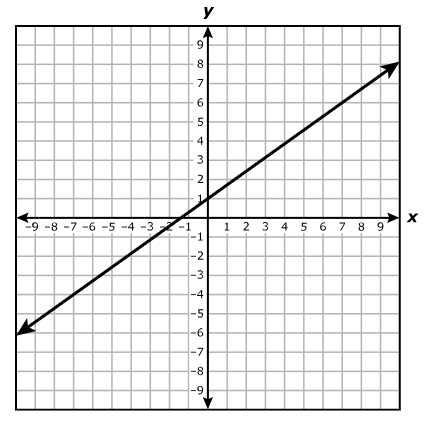
Based on the graph, what is the rate of change of the student's distance from home in miles with respect to the time in minutes?
A. Decrease of $\dfrac{3}{4}$ mi per minute.
B. Decrease of $\dfrac{4}{3}$ mi per minute.
C. Increase of $\dfrac{3}{4}$ mi per minute.
D. Increase of $\dfrac{4}{3}$ mi per minute.
The rate of change of the student's distance from home in miles with respect to the time in minutes is the slope of the graph.
$ \text{Point 1: } (0, 6) \\[3ex] x_1 = 0 \\[3ex] y_1 = 6 \\[5ex] \text{Point 2: } (8, 0) \\[3ex] x_2 = 8 \\[3ex] y_2 = 0 \\[5ex] \text{Slope, } m = \dfrac{y_2 - y_1}{x_2 - x_1} \\[5ex] m = \dfrac{0 - 6}{8 - 0} \\[5ex] m = -\dfrac{6}{8} \\[5ex] m = -\dfrac{3}{4} \\[5ex] $ This is a decrease of $\dfrac{3}{4}$ miles per minute.


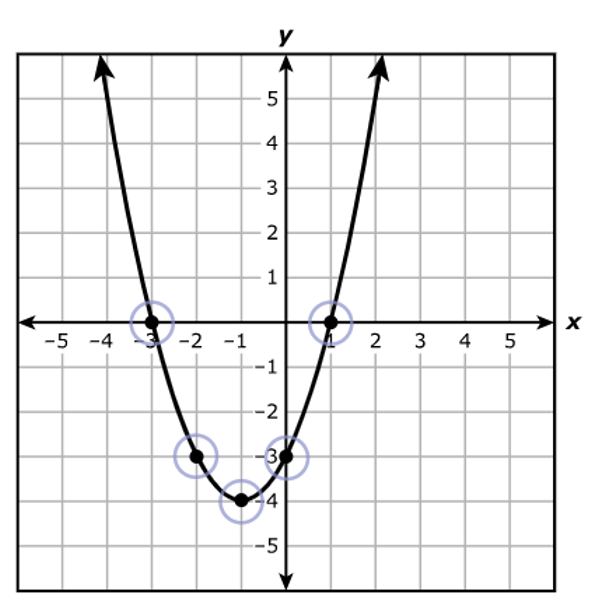
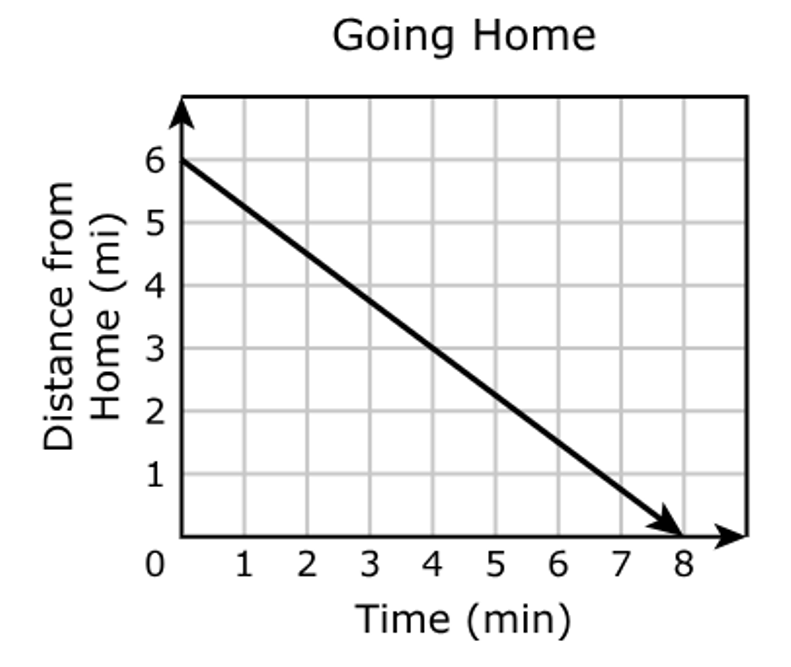
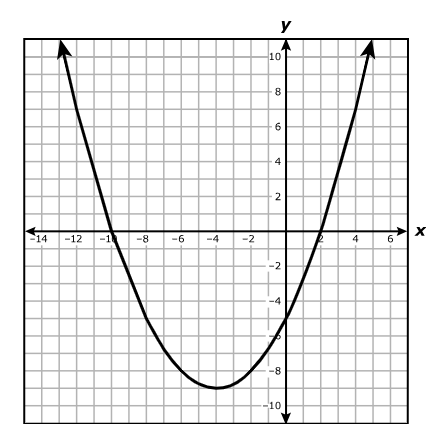
Which function is best represented by the graph of h?
$ A.\;\; h(x) = -x^2 - 8x - 15 \\[3ex] B.\;\; h(x) = -x^2 + 8x - 15 \\[3ex] C.\;\; h(x) = x^2 + 8x + 15 \\[3ex] D.\;\; h(x) = x^2 - 8x + 15 \\[3ex] $
We can solve the question using at least two approaches.
Use any approach you prefer.
$ a = \text{leading coefficient} \\[5ex] \underline{\text{1st Approach: Equation of a Quadratic Function in Factored Form}} \\[3ex] f(x) = a(x - \alpha)(x - \beta) \\[3ex] \alpha, \beta = \text{zeros of the function} \\[3ex] \alpha = -5 \\[3ex] \beta = -3 \\[5ex] \implies \\[3ex] h(x) = a[x - (-5)][x - (-3)] \\[3ex] h(x) = a(x + 5)(x + 3) \\[5ex] \text{Passes through the point (vertex) } (-4, 1) \\[3ex] x = -4 \\[3ex] h(x) = 1 \\[3ex] \implies \\[3ex] 1 = a(-4 + 5)(-4 + 3) \\[3ex] 1 = a(1)(-1) \\[3ex] -a = 1 \\[3ex] a = \dfrac{1}{-1} = -1 \\[5ex] \implies \\[3ex] h(x) = -1(x + 5)(x + 3) \\[3ex] h(x) = -1(x^2 + 3x + 5x + 15) \\[3ex] h(x) = -1(x^2 + 8x + 15) \\[3ex] h(x) = -x^2 - 8x - 15 \\[5ex] \underline{\text{2nd Approach: Equation of a Quadratic Function in Vertex Form}} \\[3ex] h(x) = a(x - h)^2 + k ...\text{where } (h, k) \text{ is the vertex} \\[3ex] (h, k) = (-4, 1) \\[3ex] h = -4 \\[3ex] k = 1 \\[3ex] \implies \\[3ex] h(x) = a[x - (-4)]^2 + 1 \\[3ex] h(x) = a(x + 4)^2 + 1 \\[5ex] \text{Passes through the point: } (-3, 0) \\[3ex] x = -3 \\[3ex] h(x) = 0 \\[3ex] \implies \\[3ex] 0 = a(-3 + 4)^2 + 1 \\[3ex] 0 = a(1)^2 + 1 \\[3ex] 0 = a(1) + 1 \\[3ex] a + 1 = 0 \\[3ex] a = -1 \\[3ex] \implies \\[3ex] h(x) = -1(x + 4)^2 + 1 \\[3ex] h(x) = -1(x + 4)(x + 4) + 1 \\[3ex] h(x) = -1(x^2 + 4x + 4x + 16) + 1 \\[3ex] h(x) = -1(x^2 + 8x + 16) + 1 \\[3ex] h(x) = -x^2 - 8x - 16 + 1 \\[3ex] h(x) = -x^2 - 8x - 15 $
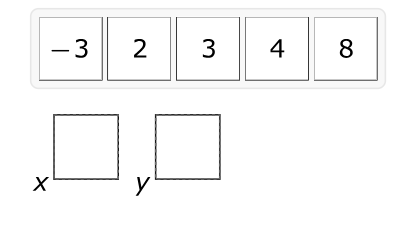
When the value of x is 4, the value of y is –12.
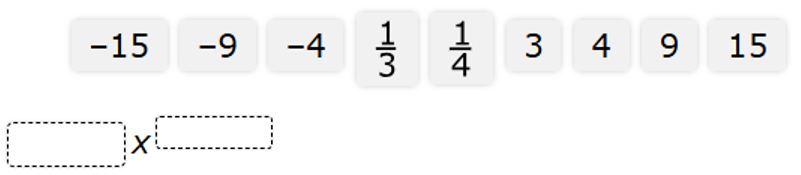
What is the constant of variation when y is a function of x, and what is the value of y when x = –6?
Move the correct answer to each box.
Each answer may be used more than once.
Not all answers will be used.
The constant of variation is
The value of y when x = –6 is
$ y \propto x \\[3ex] y = kx ...k\text{ is the constant of variation} \\[3ex] \text{When } x = 4, y = -12 \\[3ex] k = ? \\[3ex] -12 = k * 4 \\[3ex] 4k = -12 \\[3ex] k = -\dfrac{12}{4} \\[5ex] k = -3 \\[3ex] \implies \\[3ex] y = -3x \\[5ex] \text{When } x = -6, y = ? \\[3ex] y = -3(-6) \\[3ex] y = 18 $
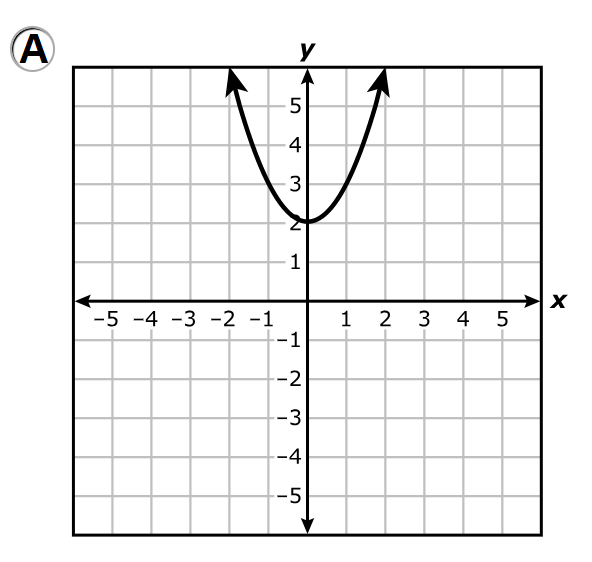
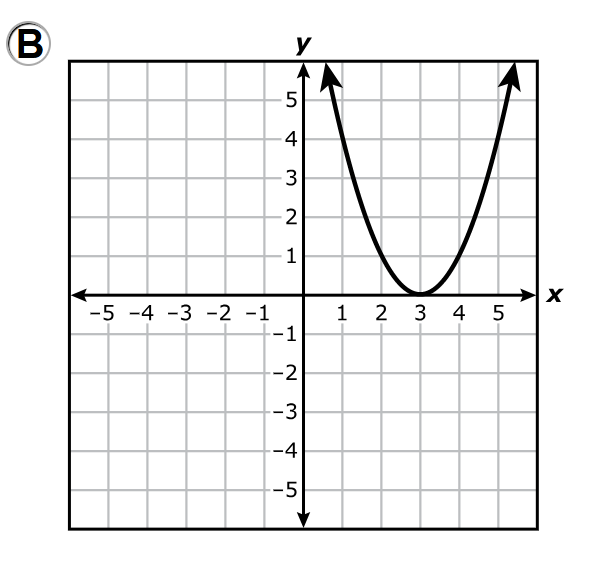
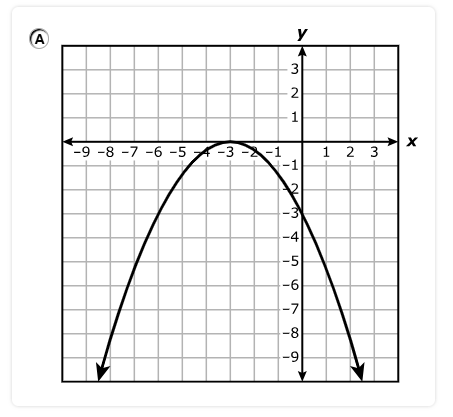
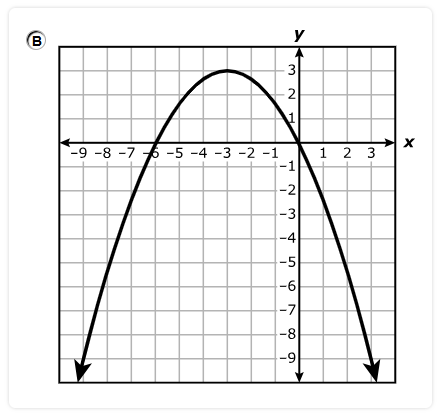
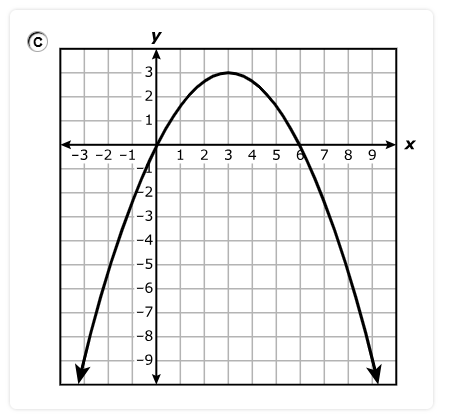
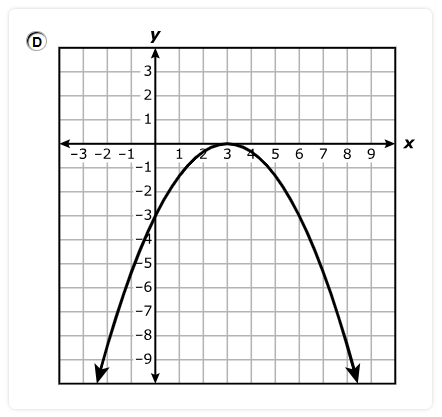
A.
B.
C.
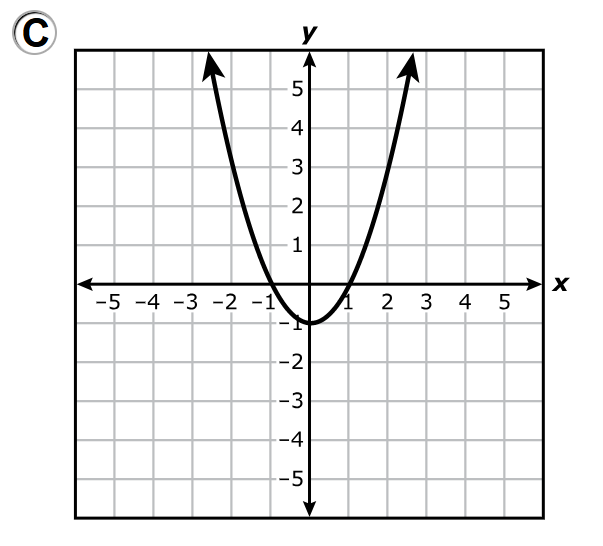
D.
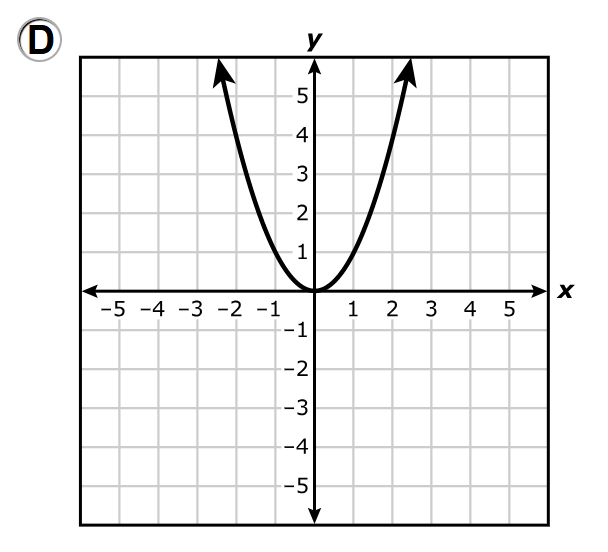
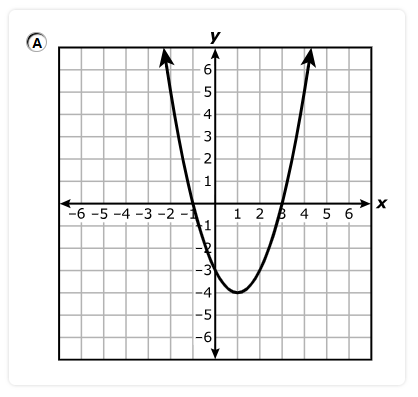
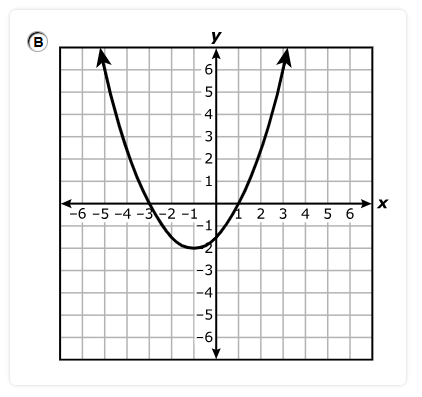
The real zeros of a quadratic function are the x-values where the graph intersects (crosses or touches) the x-axis.
The only graph that does not intersect the x-axis is the graph in Option A.
Based on this information, create an equation that can be used to find the nth term of the sequence, $a_n$
Move the correct answer to each box.
Each answer may be used more than once.
Not all answers will be used.
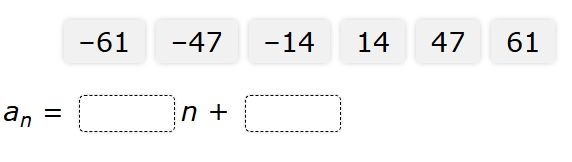
$ 47, 33, 19, 5, -9 \\[3ex] 33 - 47 = -14 \\[3ex] 19 - 33 = -14 \\[3ex] 5 - 19 = -14 \\[3ex] -9 - 5 = -14 \\[3ex] $ This is an Arithmetic Sequence because the common difference is –14
We can solve the question using at least two approaches.
Use any approach you prefer.
$ \underline{\text{1st Approach: nth term of an Arithmetic Sequence}} \\[3ex] AS_n = a + d(n - 1) \\[3ex] AS_n = \text{nth term} = a_n \\[3ex] a = \text{first term} = 47 \\[3ex] d = \text{common difference} = -14 \\[3ex] n = \text{number of terms} \\[3ex] \implies \\[3ex] a_n = 47 + -14(n - 1) \\[3ex] a_n = 47 - 14(n - 1) \\[3ex] a_n = 47 - 14n + 14 \\[3ex] a_n = -14n + 61 \\[3ex] $ For the 2nd Approach, let us represent the information as a linear function.
An Arithmetic Sequence is also known as a Linear Sequence.
| x = $n$ | y = $a_n$ |
|---|---|
| 1 | 47 |
| 2 | 33 |
| 3 | 19 |
| 4 | 5 |
| 5 | –9 |
$ \underline{\text{2nd Approach: Linear Function in Slope–Intercept Form}} \\[3ex] \text{Point 1: } (1, 47) \\[3ex] x_1 = 1 \\[3ex] y_1 = 47 \\[5ex] \text{Point 2: } (2, 33) \\[3ex] x_2 = 2 \\[3ex] y_2 = 33 \\[5ex] \text{Slope, } m = \dfrac{y_2 - y_1}{x_2 - x_1} \\[5ex] m = \dfrac{33 - 47}{2 - 1} \\[5ex] m = \dfrac{-14}{1} \\[5ex] m = -14 \\[5ex] \text{Point–Slope Form} \\[3ex] y - y_1 = m(x - x_1) \\[3ex] y - 47 = -14(x - 1) \\[5ex] \text{Slope–Intercept Form} \\[3ex] y - 47 = -14x + 14 \\[3ex] y = -14x + 14 + 47 \\[3ex] y = -14x + 61 \\[3ex] a_n = -14n + 61 $
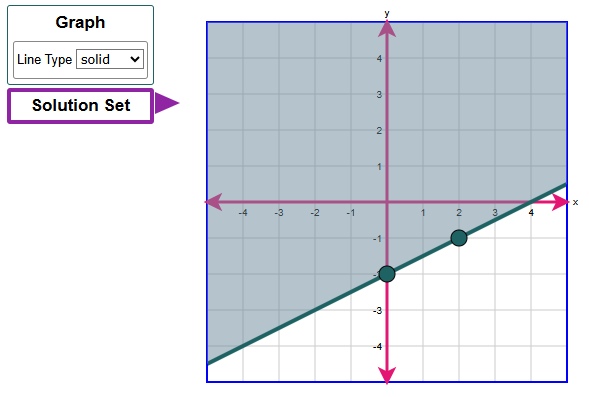
Graph the solution set of the linear inequality in the coordinate plane.
First, select the Graph button to graph the line and choose the line style.
To graph a line, select two points in the coordinate plane. A line will connect the points.
Then select the Solution Set button to select the desired region.
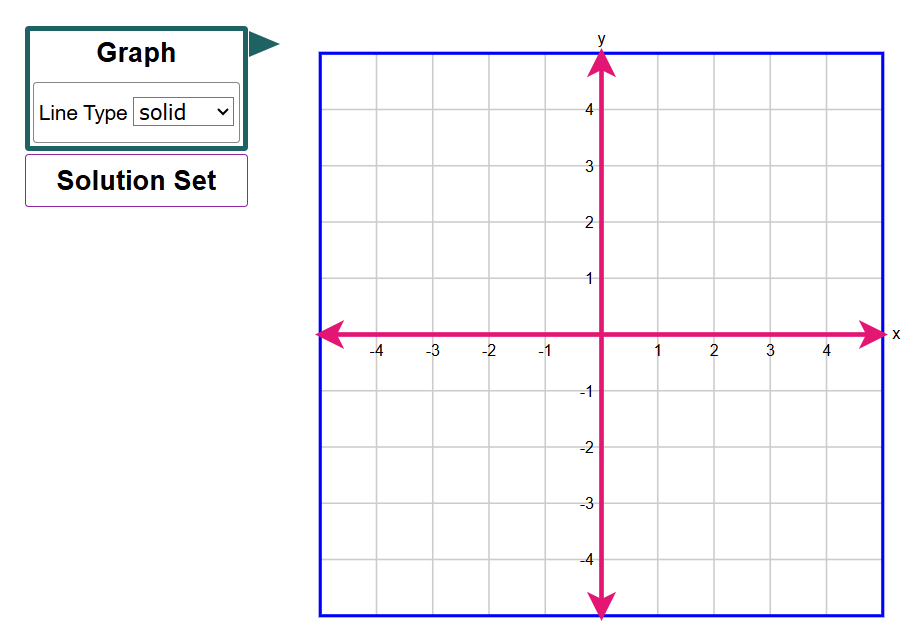
Because the inequality contains an equal sign, the line will be a solid line.
$ y \ge \dfrac{1}{2}x - 2 \\[5ex] \text{When } x = 0 \\[3ex] y \ge \dfrac{1}{2}(0) - 2 \\[5ex] y \ge 0 - 2 \\[3ex] y \ge -2 \\[5ex] \text{When } x = 2 \\[3ex] y \ge \dfrac{1}{2}(2) - 2 \\[5ex] y \ge 1 - 2 \\[3ex] y \ge -1 \\[5ex] $ Student: Mr. C, wait a minute.
Why did you not do when $x = 1$?
Is there any reason for using $x = 2$?
Teacher: Good observation.
If we used 1, we would end up with a fraction.
Fractions are not allowed in the graph that we are given.
Hence, it is necessary that we use a value of $x$ that will give an integer value of $y$ within the domain [-4, 4]
What other values could we have used?
Student: 4, 6, 8, 10, 12, –2, –4
–2
Teacher: There you go...
The graph of the inequality is
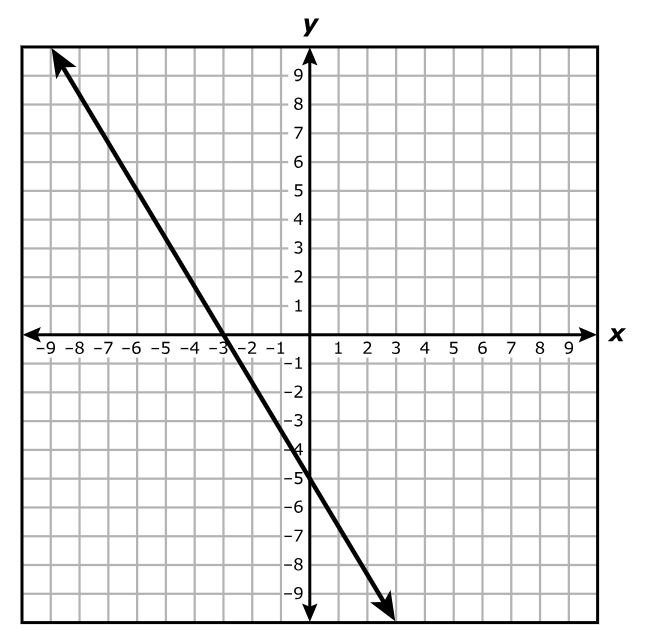
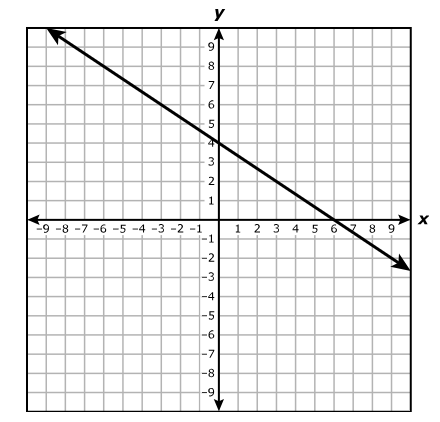
Which function best represents the relationship shown in the graph?
$ A.\;\; y = -\dfrac{3}{5}x - 5 \\[5ex] B.\;\; y = -\dfrac{3}{5}x - 3 \\[5ex] C.\;\; y = -\dfrac{5}{3}x - 5 \\[5ex] D.\;\; y = -\dfrac{5}{3}x - 3 \\[5ex] $
$ \text{Point 1: } (-3, 0) \\[3ex] x_1 = -3 \\[3ex] y_1 = 0 \\[5ex] \text{Point 2: } (0, -5) \\[3ex] x_2 = 0 \\[3ex] y_2 = -5 \\[5ex] \text{Slope, } m = \dfrac{y_2 - y_1}{x_2 - x_1} \\[5ex] m = \dfrac{-5 - 0}{0 - (-3)} \\[5ex] m = -\dfrac{5}{3} \\[5ex] \text{Point–Slope Form} \\[3ex] y - y_1 = m(x - x_1) \\[3ex] y - 0 = -\dfrac{5}{3}[x - (-3)] \\[5ex] y = -\dfrac{5}{3}(x + 3) \\[5ex] \text{Slope–Intercept Form} \\[3ex] y = mx + b ...\text{where } b \text{ is the y-intercept} \\[3ex] y = -\dfrac{5}{3}x - 5 $
The system of equations graphed on the grid represents this situation.
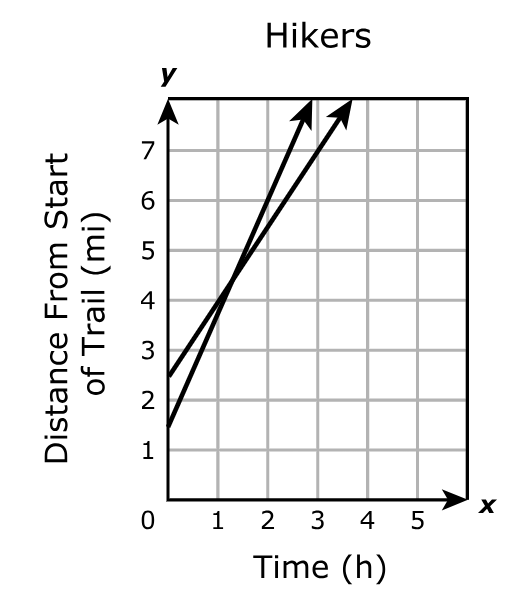
Which value best represents the number of hours the two hikers have been hiking when they are the same distance from the start of the trail?
$ A.\;\; 2.8h \\[3ex] B.\;\; 1.3h \\[3ex] C.\;\; 2.5h \\[3ex] D.\;\; 4.5h \\[3ex] $
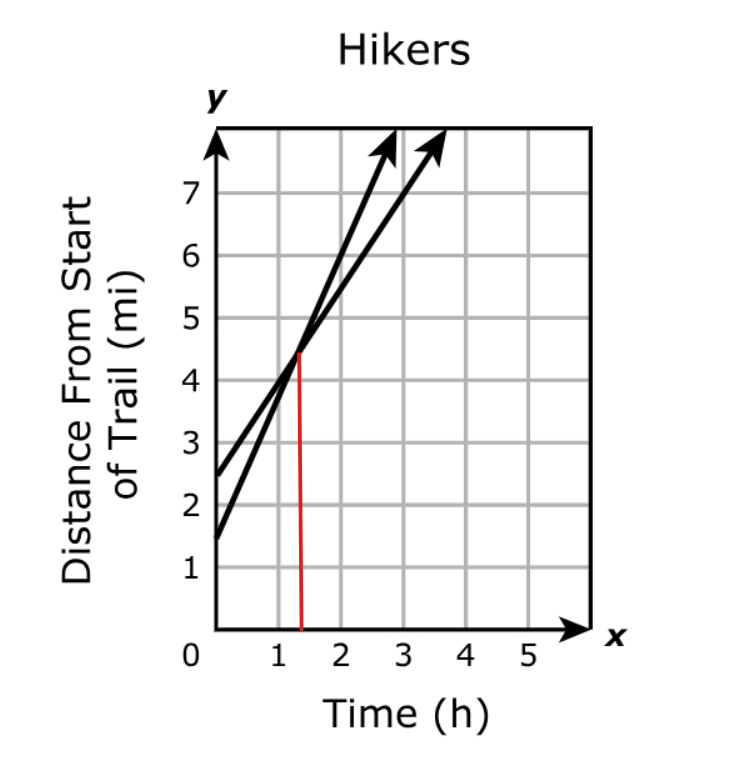
The number of hours the two hikers have been hiking when they are the same distance from the start of the trail is the point of intersection of the two graphs.
As is observed, the point of intersection is between 1 hour and 2 hours.
This is about 1.3 hours.
Which statements are true about the domain and range of the part of the function shown.
Select TWO correct answers.
Option 2: The domain is the set of all real numbers greater than or equal to 2 and less than or equal to 5.
Option 4: The range is the set of all real numbers greater than or equal to 1 and less than or equal to 8.
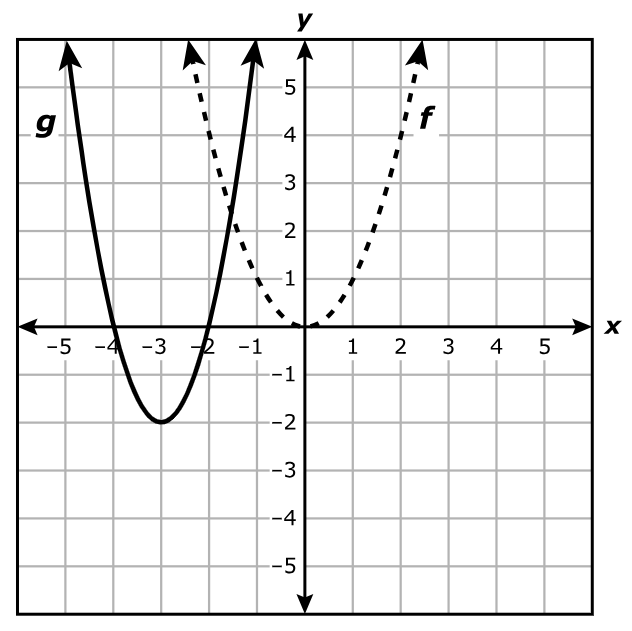
What is the equation for g?
$ A.\;\; g(x) = f(x + 3) - 2 \\[3ex] B.\;\; g(x) = 2f(x + 3) - 2 \\[3ex] C.\;\; g(x) = f(x - 3) + 2 \\[3ex] D.\;\; g(x) = 2f(x - 3) + 2 \\[3ex] $
Observing the two graphs from the graph of $f(x)$ to the graph of $g(x)$, we notice a shift to the left, a stretch, and a shift downwards. $f(x) = x^2$
Vertex of $f(x) = (0, 0)$
Vertex of $g(x) = (-3, -2)$
1st transformation:
Horizontal Shift of 3 units to the left: $(0, 0) \rightarrow (0 - 3, 0) \rightarrow (-3, 0)$
Transformed function: $f(x + 3)$
2nd transformation:
We notice a vertical stretch: a narrowing of $f(x)$ to give $g(x)$
Based on the options, we see that the y-coordinate is multiplied by 2
Vertical Stretch by a factor of 2 units: $(-3, 0) \rightarrow (-3, 0 * 2) \rightarrow (-3, 0)$
Transformed function: $2f(x + 3)$
3rd transformation:
Vertical Shift of 2 units down: $(-3, 0) \rightarrow (-3, 0 - 2) \rightarrow (-3, -2)$
Transformed function: $2f(x + 3) - 2$
$g(x) = 2f(x + 3) - 2$
Select two points on the coordinate grid. A line will connect the points.
$ 2x + 3y = 6 \\[3ex] 3y = 6 - 2x \\[3ex] y = \dfrac{6 - 2x}{3} \\[5ex] \text{When } x = 0 \\[3ex] y = \dfrac{6 - 2(0)}{3} \\[5ex] y = \dfrac{6 - 0}{3} \\[5ex] y = \dfrac{6}{3} \\[5ex] y = 2 \\[3ex] \text{Point 1: } (0, 2) \\[5ex] \text{When } x = 3 \\[3ex] y = \dfrac{6 - 2(3)}{3} \\[5ex] y = \dfrac{6 - 6}{3} \\[5ex] y = \dfrac{0}{3} \\[5ex] y = 0 \\[3ex] \text{Point 2: } (3, 0) \\[3ex] $ The graph of the equation is:
Complete the statement about the quadratic function.
Move the correct answer to each box. Not all answers will be used.

The function has a
 value of
.
value of
.
The function has a minimum value of –4
The y-intercept is 2.
The function increases at a rate of 50%.
Which graph best represents this function?
A.
B.
C.
D.
The y-intercept is 2.
This implies that one of the points on the graph is (0, 2)
The graph must pass through (0, 2)
Options A. and B. are eliminated.
Options C. and D. remain.
The function increases at a rate of 50%.
This is an exponential growth function.
Option D. is an exponential decay function. It is eliminated.
Option C. is the correct answer.
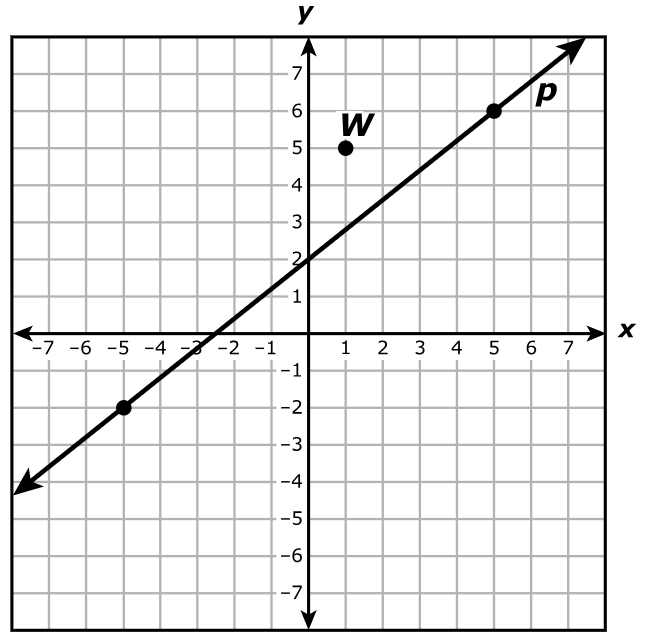
Which equation best represents the point-slope form of the line that passes through point W and is parallel to line p?
$ A.\;\; y - 5 = -\dfrac{4}{5}(x - 1) \\[5ex] B.\;\; y - 5 = \dfrac{4}{5}(x - 1) \\[5ex] C.\;\; y - 5 = -\dfrac{5}{4}(x - 1) \\[5ex] D.\;\; y - 5 = \dfrac{5}{4}(x - 1) \\[5ex] $
$ \underline{\text{Line P}} \\[3ex] \text{Point 1: } (-5, -2) \\[3ex] x_1 = -5 \\[3ex] y_1 = -2 \\[5ex] \text{Point 2: } (5, 6) \\[3ex] x_2 = 5 \\[3ex] y_2 = 6 \\[5ex] m = \dfrac{y_2 - y_1}{x_2 - x_1} \\[5ex] m = \dfrac{6 - (-2)}{5 - (-5)} \\[5ex] m = \dfrac{6 + 2}{5 + 5} \\[5ex] m = \dfrac{8}{10} \\[5ex] m = \dfrac{4}{5} \\[5ex] \underline{\text{Line W}} \\[3ex] \text{Line W } || \text{ Line P} \\[3ex] m = \dfrac{4}{5}...\text{parallel lines have the same slope} \\[5ex] \text{Passes through Point } (1, 5) \\[3ex] x_3 = 1 \\[3ex] y_3 = 5 \\[3ex] \text{Point–Slope Form} \\[3ex] y - y_3 = m(x - x_3) \\[3ex] y - 5 = \dfrac{4}{5}(x - 1) $
The table shows the linear relationship between y, the altitude of the airplane in feet, and x, the time in minutes.
| Time, x (minutes) | Altitude, y (feet) |
|---|---|
| 1.5 | 25,500 |
| 3.25 | 20,250 |
| 6 | 12,000 |
Complete the statement that describes the rate of change of the altitude of the airplane with respect to time.
Choose the correct answer from each drop-down menu to complete the sentence.
The altitude of the airplane
at a rate of
feet per minute.
The rate of change of the altitude of the airplane with respect to time is the slope.
Observing the pattern, as the time increases, the altitude decreases.
We should expect a negative slope.
$ \text{Point 1: } (1.5, 25500) \\[3ex] x_1 = 1.5 \\[3ex] y_1 = 25500 \\[5ex] \text{Point 2: } (6, 12000) \\[3ex] x_2 = 6 \\[3ex] y_2 = 12000 \\[5ex] \text{Slope} = \dfrac{y_2 - y_1}{x_2 - x_1} \\[5ex] = \dfrac{12000 - 25500}{6 - 1.5} \\[5ex] = -\dfrac{13500}{4.5} \\[5ex] = -3000 \\[3ex] $ The altitude of the airplane decreases at a rate of 3000 feet per minute.
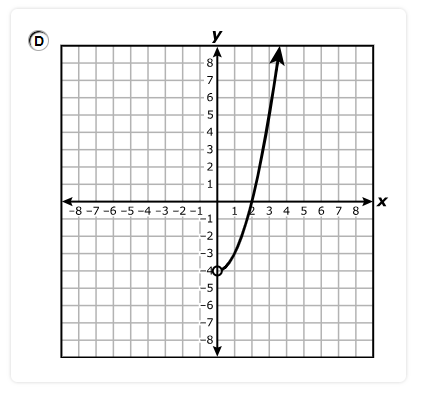
What is the domain of the part of the function shown?
A. All real numbers greater than or equal to –4 and less than or equal to 5
B. All real numbers greater than or equal to –1 and less than or equal to 3
C. All real numbers greater than or equal to –6 and less than or equal to 6
D. All real numbers greater than or equal to –2 and less than or equal to 3
The domain is the set of all the input values, x for which the function has an output.
The closed circle represents a closed interval.
On the graph,
It is on the left hand side at x = –2
It is on the right hand side at x = 3
So, the interval notation is: $[-2, 3]$
This represents all real numbers between –2 and 3 (both ends included).
This means all real numbers greater than or equal to –2 and less than or equal to 3.
What is a possible equation for h in factored form?
Move the correct answer to each box. Not all answers will be used.
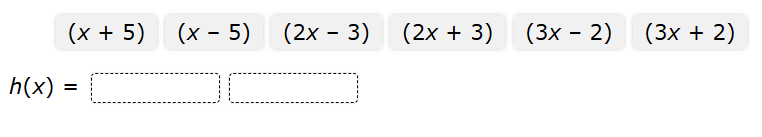
$ \underline{\text{Zeros}} \\[3ex] 1st:\;\; x = -\dfrac{3}{2} \\[5ex] 2nd:\;\; x = 5 \\[5ex] \underline{\text{Equate to number zero}} \\[3ex] 1st:\;\; 2x = -3 \\[3ex] 2x + 3 = 0 \\[3ex] 2nd:\;\;x - 5 = 0 \\[5ex] \underline{\text{Factors}} \\[3ex] 1st:\;\; 2x + 3 \\[3ex] 2nd:\;\; x - 5 \\[5ex] \underline{\text{Factored Form}} \\[3ex] (2x + 3)(x - 5) $
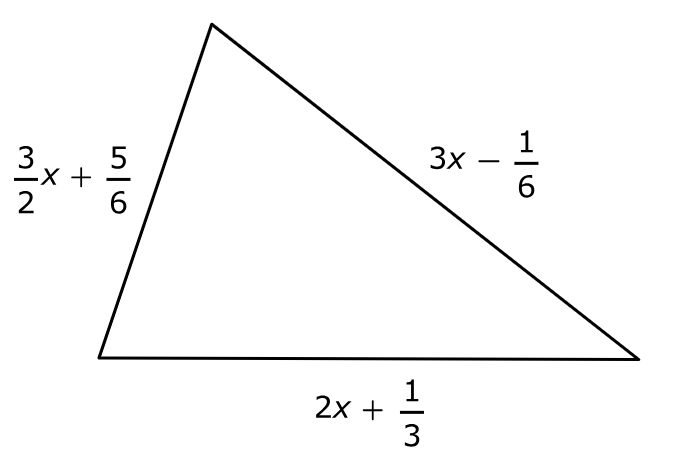
Which expression represents the perimeter of the triangle in units?
$ A.\;\; \dfrac{15}{2}x \\[5ex] B.\;\; \dfrac{47}{6}x \\[5ex] C.\;\; \dfrac{13}{2}x + 1 \\[5ex] D.\;\; \dfrac{13}{2}x + \dfrac{4}{3} \\[5ex] $
$ \text{Perimeter} \\[3ex] = \left(\dfrac{3}{2}x + \dfrac{5}{6}\right) + \left(3x - \dfrac{1}{6}\right) + \left(2x + \dfrac{1}{3}\right) \\[5ex] = \dfrac{3}{2}x + \dfrac{5}{6} + 3x - \dfrac{1}{6} + 2x + \dfrac{1}{3} \\[5ex] = \dfrac{3}{2}x + 3x + 2x + \dfrac{5}{6} - \dfrac{1}{6} + \dfrac{1}{3} \\[5ex] = \dfrac{3x}{2} + 5x + \dfrac{4}{6} + \dfrac{1}{3} \\[5ex] = \dfrac{3x + 10x}{2} + \dfrac{4 + 2}{6} \\[5ex] = \dfrac{13x}{2} + \dfrac{6}{6} \\[5ex] = \dfrac{13x}{2} + 1 $
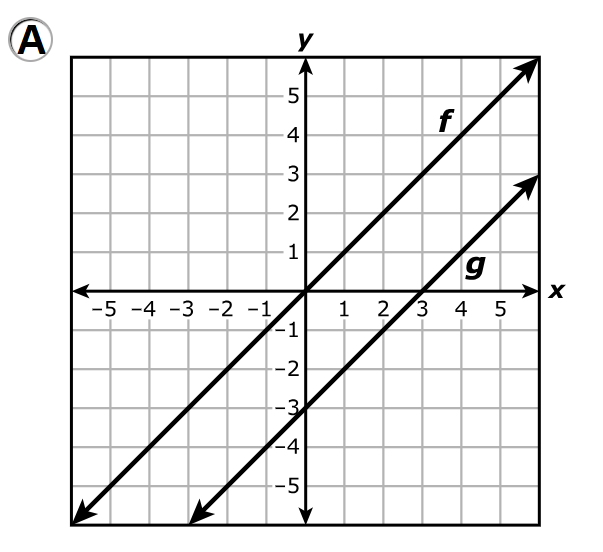
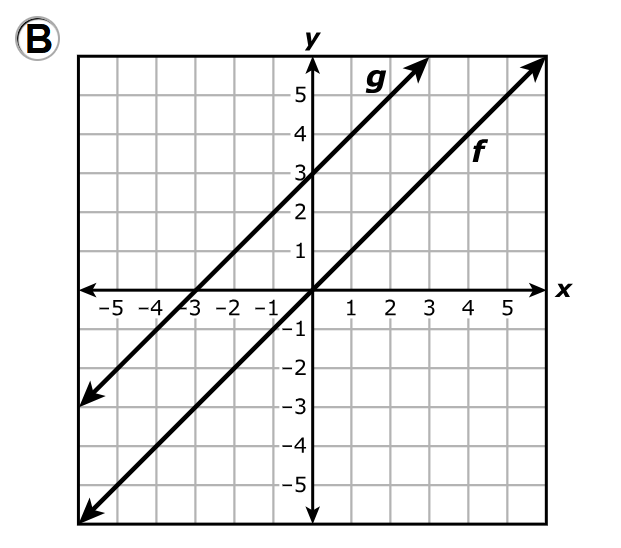
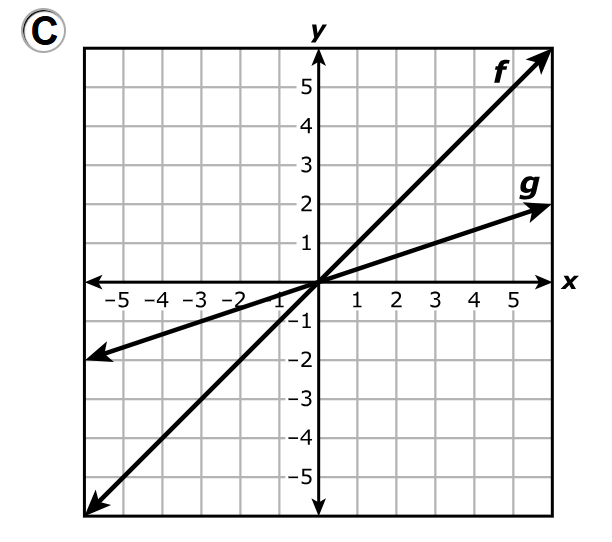
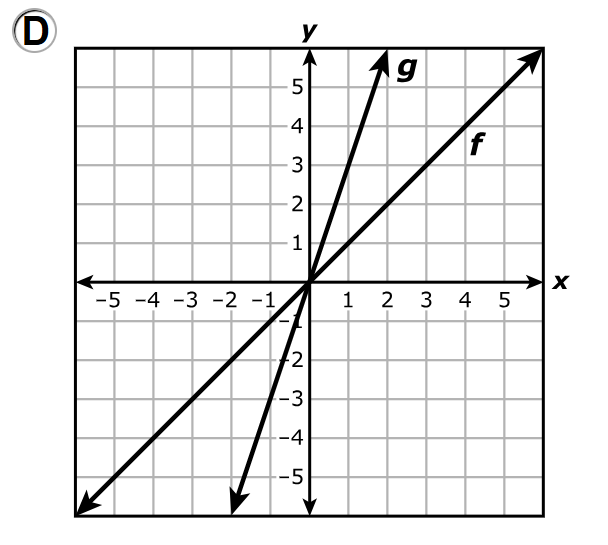
Complete the statement to compare the graphs of f and g.
Choose the correct answer from each drop-down menu to complete the sentence.
The graph of g is
the graph of f and has a y-intercept that is
that of f.
$ f(x) = x \\[3ex] g(x) = \dfrac{1}{2}f(x) + 3 \\[5ex] $ Transformation of $f(x)$ to give $g(x)$
1st: Vertical Compression of $f(x)$ by a factor of $\dfrac{1}{2}$ unit
This makes the graph of $g(x)$ to be less than steep than that of $f(x)$
2nd: Vertical Shift of $f(x)$ 3 units up
This moves up the modified graph of $f(x)$ by 3 units.
In other words, all y-coordinates increase by 3 units.
The graph of g is less steep than the graph of f and has a y-intercept that is greater than that of f.
The table of ordered pairs represents some points on line p
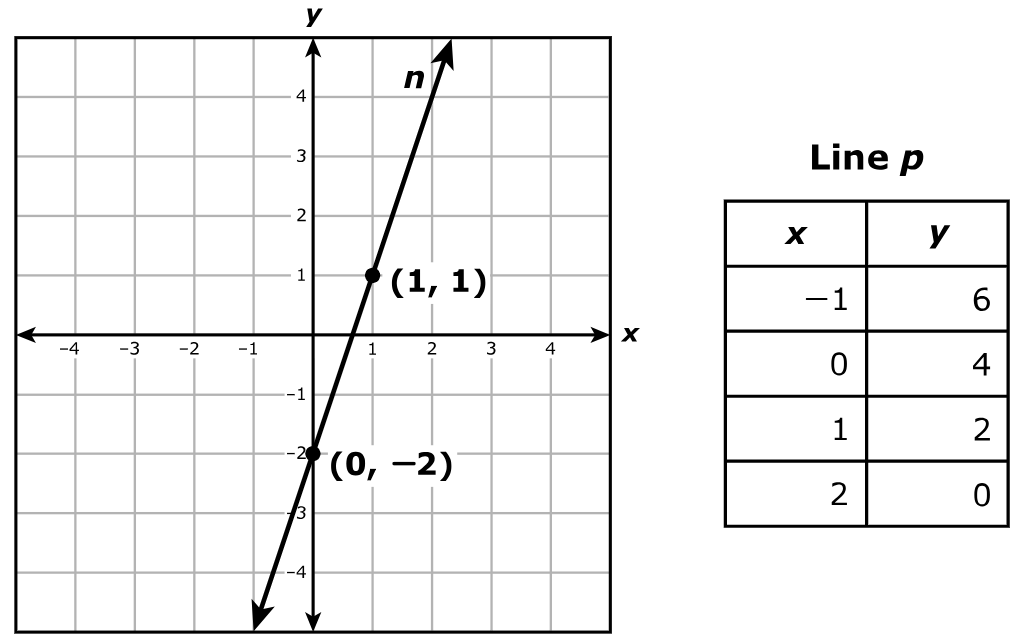
Which system of equations represents line n and line p?
$ A.\;\; 3x - y = 2 \\[3ex] \hspace{1.6em} 2x + y = 4 \\[5ex] B.\;\; 3x + y = -2 \\[3ex] \hspace{1.6em} 2x + y = 4 \\[5ex] C.\;\; 3x - y = 2 \\[3ex] \hspace{1.6em} x + 2y = 4 \\[5ex] D.\;\; 3x + y = -2 \\[3ex] \hspace{1.6em} x + 2y = 4 \\[3ex] $
$ \text{slope} = m \\[3ex] \text{y-intercept} = b \\[5ex] \underline{\text{Line } n} \\[3ex] \text{Point 1: } (0, -2) \\[3ex] x_1 = 0 \\[3ex] y_1 = -2 \\[5ex] \text{Point 2: } (1, 1) \\[3ex] x_2 = 1 \\[3ex] y_2 = 1 \\[5ex] m = \dfrac{y_2 - y_1}{x_2 - x_1} \\[5ex] m = \dfrac{1 - (-2)}{1 - 0} \\[5ex] m = \dfrac{3}{1} \\[5ex] m = 3 \\[5ex] b = -2 \\[5ex] \text{Slope–Intercept Form} \\[3ex] y = mx + b \\[3ex] y = 3x - 2 \\[5ex] \text{Standard Form} \\[3ex] 2 = 3x - y \\[3ex] 3x - y = 2 \\[5ex] \underline{\text{Line } p} \\[3ex] \text{Point 1: } (-1, 6) \\[3ex] x_1 = -1 \\[3ex] y_1 = 6 \\[5ex] \text{Point 2: } (2, 0) \\[3ex] x_2 = 2 \\[3ex] y_2 = 0 \\[5ex] m = \dfrac{y_2 - y_1}{x_2 - x_1} \\[5ex] m = \dfrac{0 - 6}{2 - (-1)} \\[5ex] m = \dfrac{-6}{3} \\[5ex] m = -2 \\[5ex] b = 4 \\[5ex] \text{Slope–Intercept Form} \\[3ex] y = mx + b \\[3ex] y = -2x + 4 \\[5ex] \text{Standard Form} \\[3ex] y + 2x = 4 \\[3ex] 2x + y = 4 $
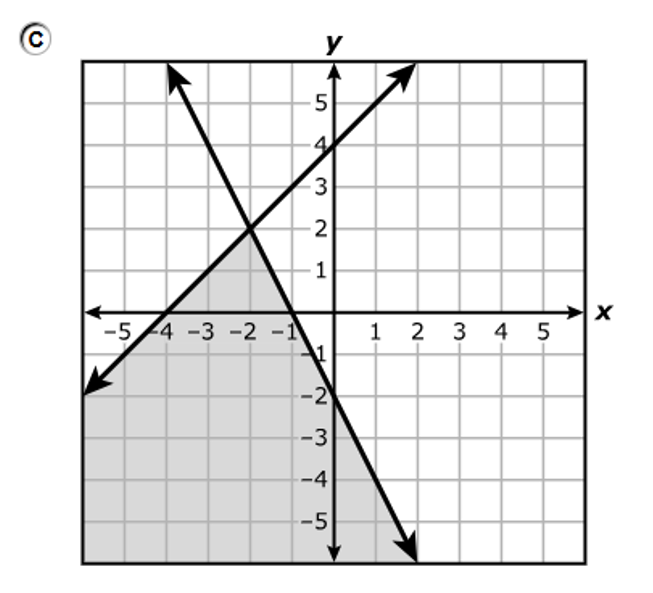
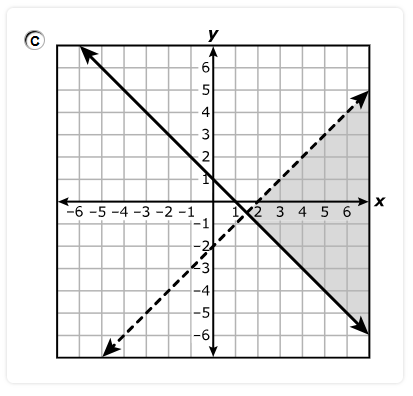
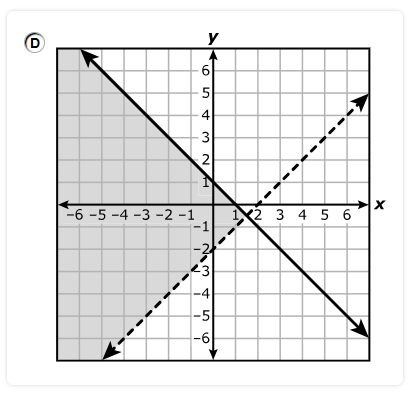
A.
B.
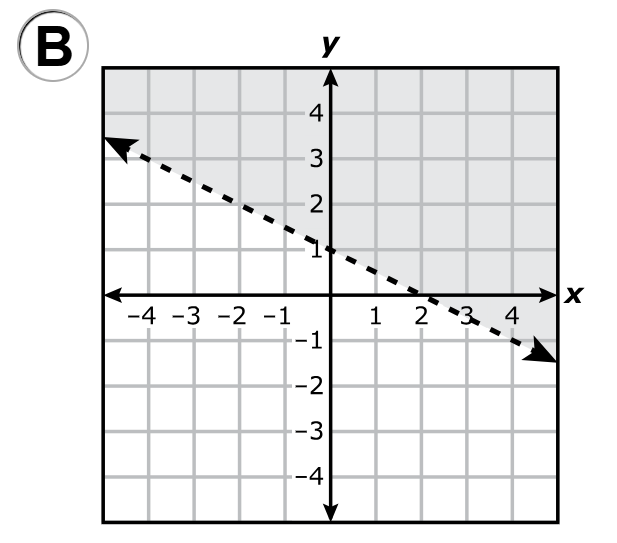
C.
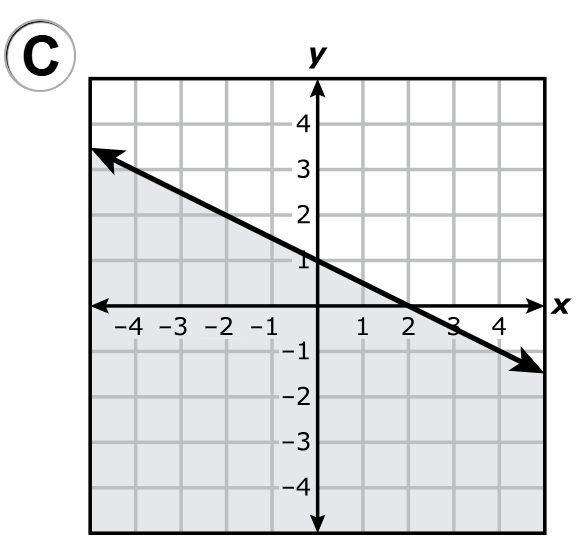
D.

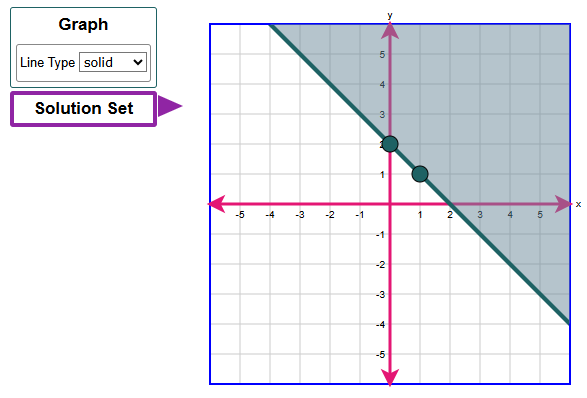
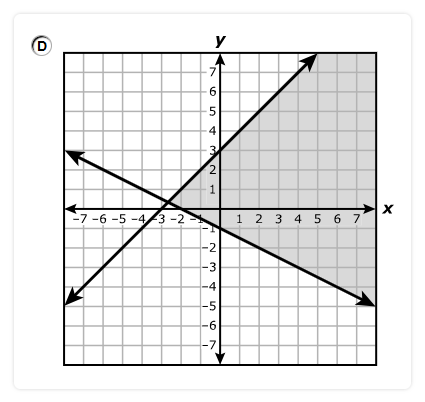
$ x + 2y \ge 2 \\[3ex] \text{When } x = 0 \\[3ex] 0 + 2y \ge 2 \\[3ex] 2y \ge 2 \\[3ex] y \ge \dfrac{2}{2} \\[5ex] y \ge 1 ...\text{Mark point } (0, 1) \\[3ex] \text{The shaded area is upwards from } y = 1 \\[5ex] \text{When } y = 0 \\[3ex] x + 2(0) \ge 2 \\[3ex] x + 0 \ge 2 \\[3ex] x \ge 2 ...\text{Mark point } (2, 0) \\[3ex] \text{The shaded area is to the right of } x = 2 \\[3ex] $ Draw a straight solid line (because of the equal sign) connecting the two points: (0, 1) and (2, 0)
Shade the regions accordingly.
Locate the overlap of the two regions.
The correct answer is Option A.
The number of employees is expected to grow at a rate of 2% each year.
Write an exponential function to model the number of employees in the company, y, after x years.
Enter your answer in the box provided.
$ \underline{\text{Exponential Growth Function}} \\[3ex] y = a(1 + r)^x \\[3ex] a = \text{initial value} = 500 \\[3ex] r = \text{growth rate} = 2\% = \dfrac{2}{100} = 0.02 \\[5ex] y = 500(1 + 0.02)^x \\[3ex] y = 500(1.02)^x \\[3ex] y = 500 \cdot 1.02^x $
A.
B.
C.
D.
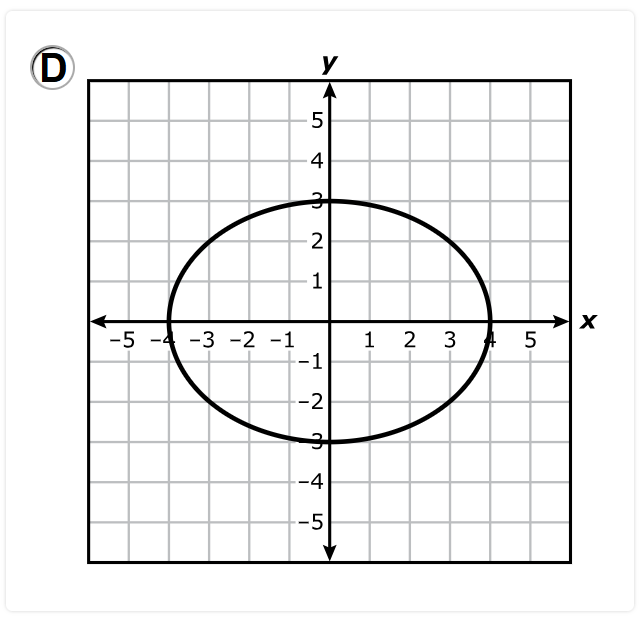
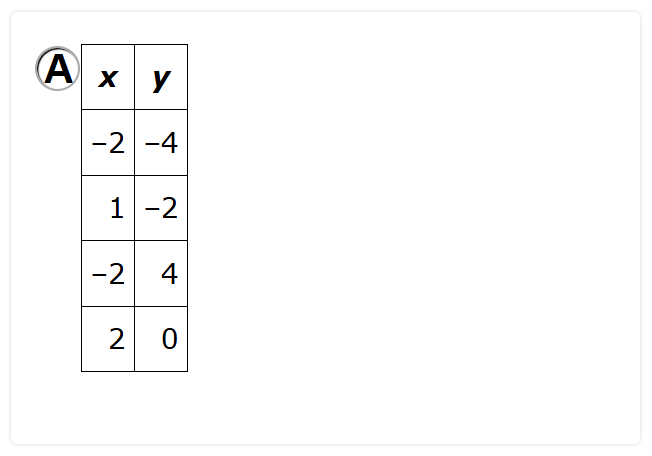
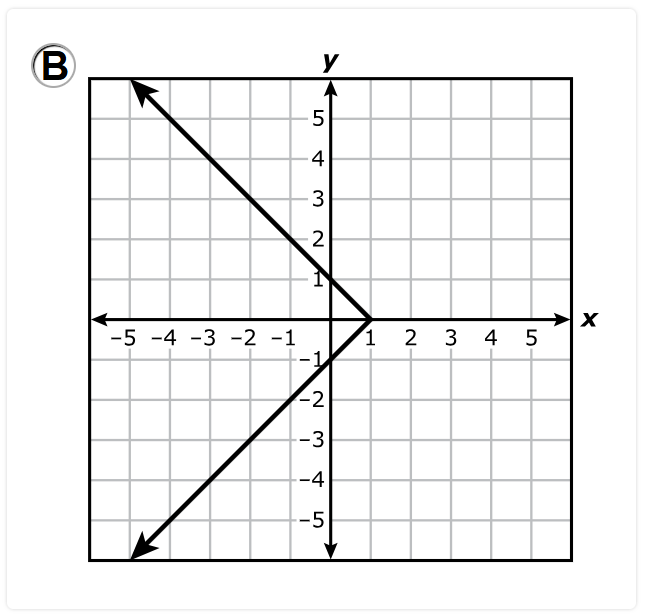
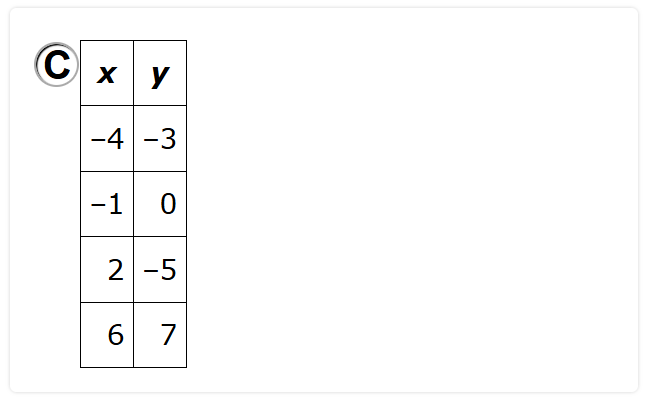
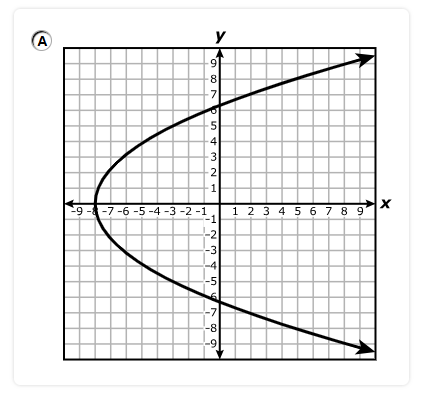
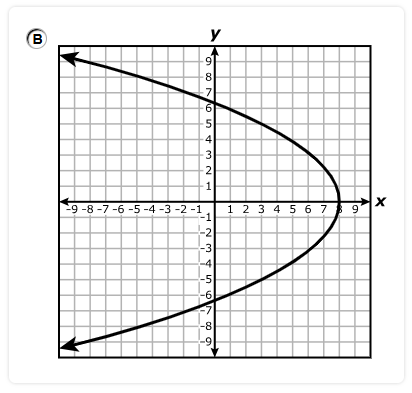
A function is a relation in which each input has a unique output.
This means that an input can have only one output, two inputs can have the same output, however, an input cannot have more than one output.
Let us analyze each option and discard the incorrect ones.
Option A.
The input, –2 has two different outputs, –4 and 4.
This is not a function.
Option B.
Vertical Line Test: A vertical line through the graph intersects it at more than one point.
This implies that at least one input, say –3 has two different outputs, 4 and –4
This is not a function.
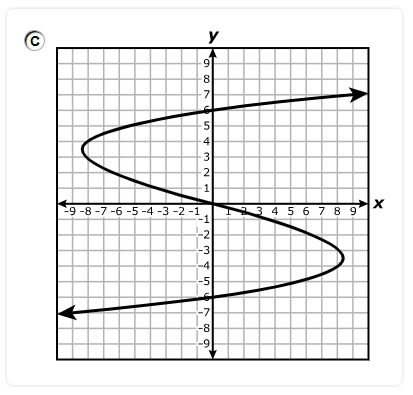
Option C.
Each input has a different output.
This is a function.
It is a one-to-one (injective) function.
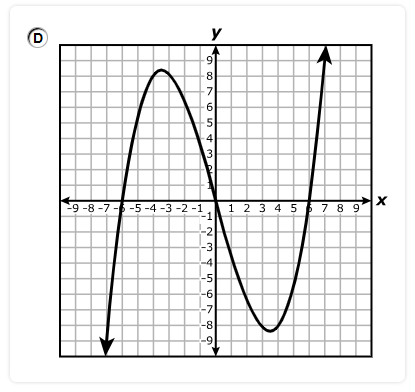
Option D.
Vertical Line Test: A vertical line through the graph intersects it at more than one point.
This implies that at least one input, say –3 has two different outputs, 2 and –2
This is not a function.
Move the correct answer to each box. Each answer may be used more than once. Not all answers will be used.
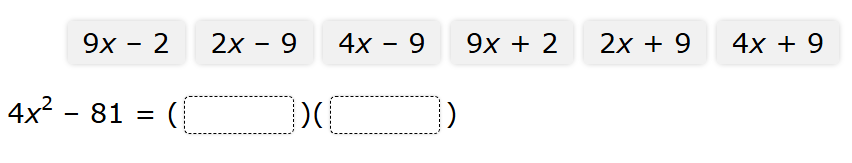
$ 4x^2 - 81 \\[3ex] 2^2x^2 - 9^2 \\[3ex] (2x)^2 - 9^2 \\[3ex] (2x + 9)(2x - 9) ...\text{Difference of Two Squares} $
The part of the linear function shown represents the distance the athlete ran in yards, y, as a function of the time in seconds, x.
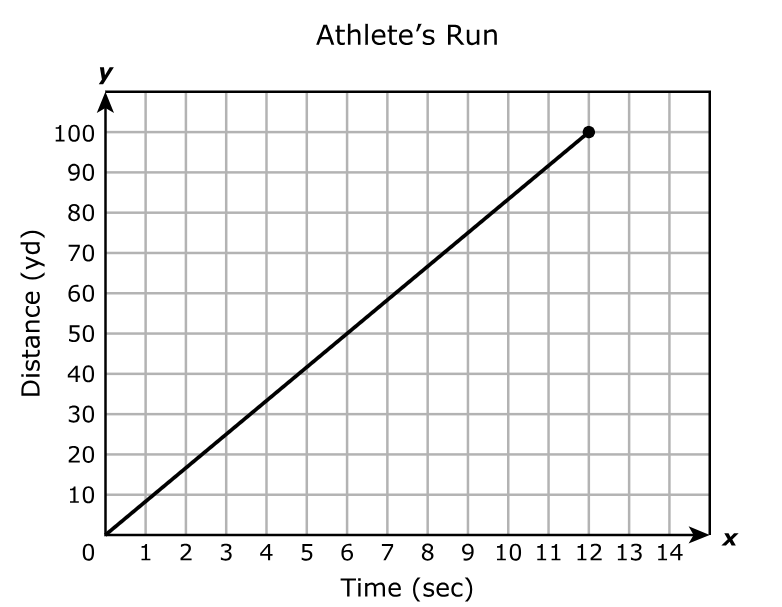
What is the domain of the function for this situation?
$ A.\;\; 0 \le x \le 14 \\[3ex] B.\;\; 0 \le x \le 12 \\[3ex] C.\;\; 0 \le y \le 110 \\[3ex] D.\;\; 0 \le y \le 100 \\[3ex] $
The domain is the set of all the input values, x for which the function has an output.
The closed circle represents a closed interval. It shows that the endpoint is included.
For the graph:
The graph starts from the origin at x = 0
The circle on the right hand side is at x = 12
The interval notation is: [0, 12]
The set notation is: Domain = $\{x: 0 \le x \le 12 \}$
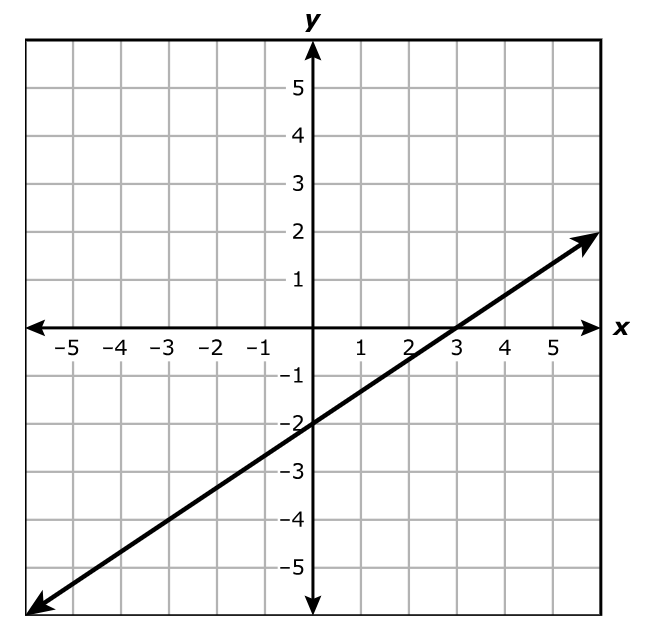
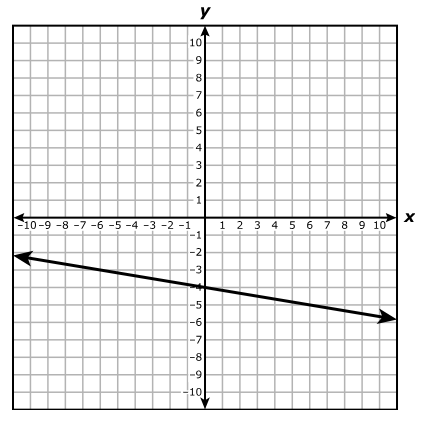
What value best represents the y-intercept of the line?
$ A.\;\; -2 \\[3ex] B.\;\; -\dfrac{3}{2} \\[5ex] C.\;\; \dfrac{2}{3} \\[5ex] D.\;\; 3 \\[3ex] $
The y-intercept is the point where the graph intersects the y-axis.
The graph intersects the y-axis at (0, –2)
Hence, the y-intercept is (0, –2)
The graph shows the relationship between time in hours, x, and the water level in meters, y.
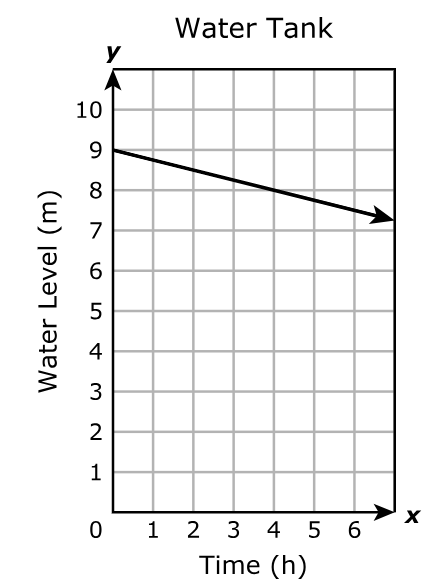
Complete the statement that describes the rate of change of the water level with respect to time.
Move the correct answer to each box. Not all answers will be used.

The water level
 at a rate of
m/h.
at a rate of
m/h.
The rate of change of tof the water level with respect to time is the slope of the graph.
$ \text{Point 1: } (0, 9) \\[3ex] x_1 = 0 \\[3ex] y_1 = 9 \\[5ex] \text{Point 2: } (4, 8) \\[3ex] x_2 = 4 \\[3ex] y_2 = 8 \\[5ex] \text{Slope, } m = \dfrac{y_2 - y_1}{x_2 - x_1} \\[5ex] m = \dfrac{8 - 9}{4 - 0} \\[5ex] m = -\dfrac{1}{4} \\[5ex] m = -0.25...\text{This is a decrease because of the negative sign.} \\[3ex] $ The water level decreases at a rate of 0.25 m/h.
Which function best represents h?
$ A.\;\; h(x) = x^2 + 2x - 3 \\[3ex] B.\;\; h(x) = x^2 - 2x - 3 \\[3ex] C.\;\; h(x) = x^2 + 4x + 3 \\[3ex] D.\;\; h(x) = x^2 - 4x + 3 \\[3ex] $
Let:
α, β be the zeros of the function
a = leading coefficient
$ \alpha = -3 \\[3ex] \beta = 1 \\[3ex] h(x) = a(x - \alpha)(x - \beta) \\[3ex] h(x) = a[x - (-3)](x - 1) \\[3ex] h(x) = a(x + 3)(x - 1) \\[3ex] \text{Passes through the vertex: } (-1, -4) \\[3ex] x = -1 \\[3ex] h(x) = -4 \\[3ex] \implies \\[3ex] -4 = a(-1 + 3)(-1 - 1) \\[3ex] -4 = a(2)(-2) \\[3ex] -4 = -4a \\[3ex] -4a = -4 \\[3ex] a = \dfrac{-4}{-4} \\[5ex] a = 1 \\[3ex] \implies \\[3ex] h(x) = 1(x + 3)(x - 1) \\[3ex] h(x) = x^2 - x + 3x - 3 \\[3ex] h(x) = x^2 + 2x - 3 $
What is the range of the part of the linear function shown?
Choose the correct answer from each drop-down menu to complete the sentence.
The range is the set of all real numbers
and
.
The range is the set of all the output values, y produced by the input values of the function.
The closed circle represents a closed interval.
On the graph, the closed circle appears on the left-hand side at y = 2
This value is included.
The open circle represents an open interval.
On the graph, the open circle appears on the right-hand side at y = -4
This value is not included.
So, the interval notation is: $(-4, 2]$
This represents all real numbers between –4 (excluded) and 2 (included).
The range is the set of all real numbers greater than –4 and less than or equal to 2.
Move the correct answer to each box. Not all answers will be used.
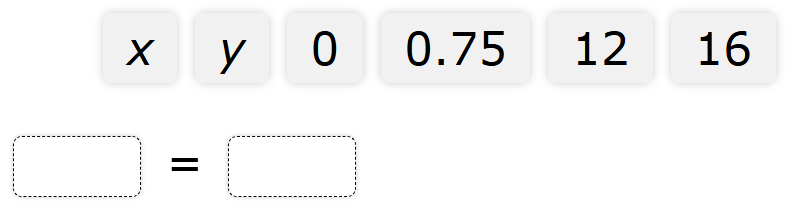
The only asymptote that applies to standard exponential functions is the horizontal asymptote.
A horizontal asymptote is the horizontal line say y = k where the graph/output approaches the specific value, k as the input, x increases or decreases without bound.
$ 0.75 = \dfrac{75}{100} = \dfrac{3}{4} \\[5ex] y = 16(0.75)^x \\[3ex] y = 16\left(\dfrac{3}{4}\right)^x \\[5ex] \text{As } x \to \infty, \\[3ex] y = 16\left(\dfrac{3}{4}\right)^\infty \\[5ex] y = 16(0) \\[3ex] y = 0 \\[5ex] \text{As } x \to -\infty, \\[3ex] y = 16\left(\dfrac{3}{4}\right)^{-\infty} \\[5ex] y = 16\left(\dfrac{4}{3}\right)^\infty ...\text{Law 6 Exp} \\[5ex] y = 16(\infty) \\[3ex] y = \infty \\[3ex] $ Because ∞ is not a value, the horizontal asymptote is: $y = 0$
Each hat costs $7, and each T-shirt costs $10.
The customer receives free shipping if the amount of the order is over $100.
Write an inequality that represents all possible combinations of hats, x, and T-shirts, y, in an order that qualifies for free shipping.
Move the correct answer to each box. Not all answers will be used.
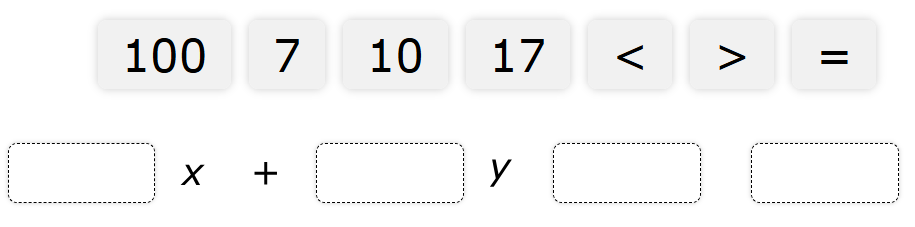
Each hat costs $7, and each T-shirt costs $10.
... hats, x, and T-shirts, y
x hats @ $7 per hat = $7x$
y T-shirts @ $10 per T-shirt = $10y$
Total cost = $7x + 10y$
The customer receives free shipping if the amount of the order is over $100.
This implies that:
$7x + 10y \gt 100$
Which graph represents f and g?
A.
B.
C.
D.
$ f(x) = x \\[3ex] g(x) = 3f(x) = 3x \\[3ex] \text{This means that when: } x = 1 \\[3ex] f(1) = 1 \\[3ex] g(1) = 3(1) = 3 \\[3ex] $ Let us analyze each option and discard the incorrect ones.
$ \text{When } x = 1 \\[5ex] \text{Option A.} \\[3ex] f(1) = 1 \\[3ex] g(1) = -2 \ne 3 ...\text{Discard} \\[3ex] \text{NEXT} \\[3ex] \text{Option B.} \\[3ex] f(1) = 1 \\[3ex] g(1) = 4 \ne 3 ...\text{Discard} \\[3ex] \text{NEXT} \\[3ex] \text{Option C.} \\[3ex] f(1) = 1 \\[3ex] g(1) \ne 3 ...\text{Discard} \\[3ex] \text{NEXT} \\[3ex] \text{Option D.} \\[3ex] f(1) = 1 \\[3ex] g(1) = 3 ...\text{This is the correct option.} $
$ A.\;\; (5, -4) \\[3ex] B.\;\; (-2, -5) \\[3ex] C.\;\; (9, 1) \\[3ex] D.\;\; (-8, 3) \\[3ex] $
There are at least two approaches to solving this question.
Use any approach you prefer.
1st Approach: Algebraic Solution
This involves checking each option to see the one that satisfies the inequality.
$ y \le \dfrac{3}{5}x - 6 \\[5ex] \text{Option A.} \\[3ex] (5, -4) \\[3ex] x = 5 \\[3ex] y = -4 \\[3ex] -4 \stackrel{?}{\le} \dfrac{3}{5} * 5 - 6 \\[5ex] -4 \stackrel{?}{\le} 3 - 6 \\[3ex] -4 \le -3...\text{Yes, this is the correct answer} \\[5ex] \text{Option B.} \\[3ex] (-2, -5) \\[3ex] x = -2 \\[3ex] y = -5 \\[3ex] -5 \stackrel{?}{\le} \dfrac{3}{5} * -2 - 6 \\[5ex] -5 \stackrel{?}{\le} -\dfrac{6}{5} - \dfrac{30}{5} \\[5ex] -\dfrac{25}{5} \stackrel{?}{\le} -\dfrac{36}{5} \\[5ex] -\dfrac{25}{5} \ge -\dfrac{36}{5} \\[5ex] \text{Discard}. \\[5ex] \text{Option C.} \\[3ex] (9, 1) \\[3ex] x = 9 \\[3ex] y = 1 \\[3ex] 1 \stackrel{?}{\le} \dfrac{3}{5} * 9 - 6 \\[5ex] 1 \stackrel{?}{\le} \dfrac{27}{5} - \dfrac{30}{5} \\[5ex] \dfrac{5}{5} \stackrel{?}{\le} -\dfrac{3}{5} \\[5ex] \dfrac{5}{5} \ge -\dfrac{3}{5} \\[5ex] \text{Discard}. \\[5ex] \text{Option D.} \\[3ex] (-8, 3) \\[3ex] x = -8 \\[3ex] y = 3 \\[3ex] 3 \stackrel{?}{\le} \dfrac{3}{5} * -8 - 6 \\[5ex] 3 \stackrel{?}{\le} -\dfrac{24}{5} - \dfrac{30}{5} \\[5ex] \dfrac{15}{5} \stackrel{?}{\le} -\dfrac{54}{5} \\[5ex] \dfrac{15}{5} \ge -\dfrac{54}{5} \\[5ex] \text{Discard}. \\[3ex] $ 2nd Approach: Graphical Solution
They gave us a graph, so apparently, they want us to graph the inequality and use that graph in determining the solution.
Because the inequality contains an equal sign, the line will be a solid line.
$ y \le \dfrac{3}{5}x - 6 \\[5ex] \text{When } x = 0 \\[3ex] y \le \dfrac{3}{5} * 0 - 6 \\[5ex] y \le 0 - 6 \\[3ex] y \le -6 \\[5ex] \text{When } x = 5 \\[3ex] y \le \dfrac{3}{5} * 5 - 6 \\[5ex] y \le 3(1) - 6 \\[3ex] y \le 3 - 6 \\[3ex] y \le -3 \\[5ex] \text{When } y = 0 \\[3ex] 0 \le \dfrac{3}{5}x - 6 \\[5ex] \dfrac{3}{5}x - 6 \ge 0 \\[5ex] \dfrac{3}{5}x \ge 6 \\[5ex] 3x \ge 5(6) \\[3ex] x \ge \dfrac{5(6)}{3} \\[5ex] x \ge 10 \\[3ex] $ The graph of the inequality is:
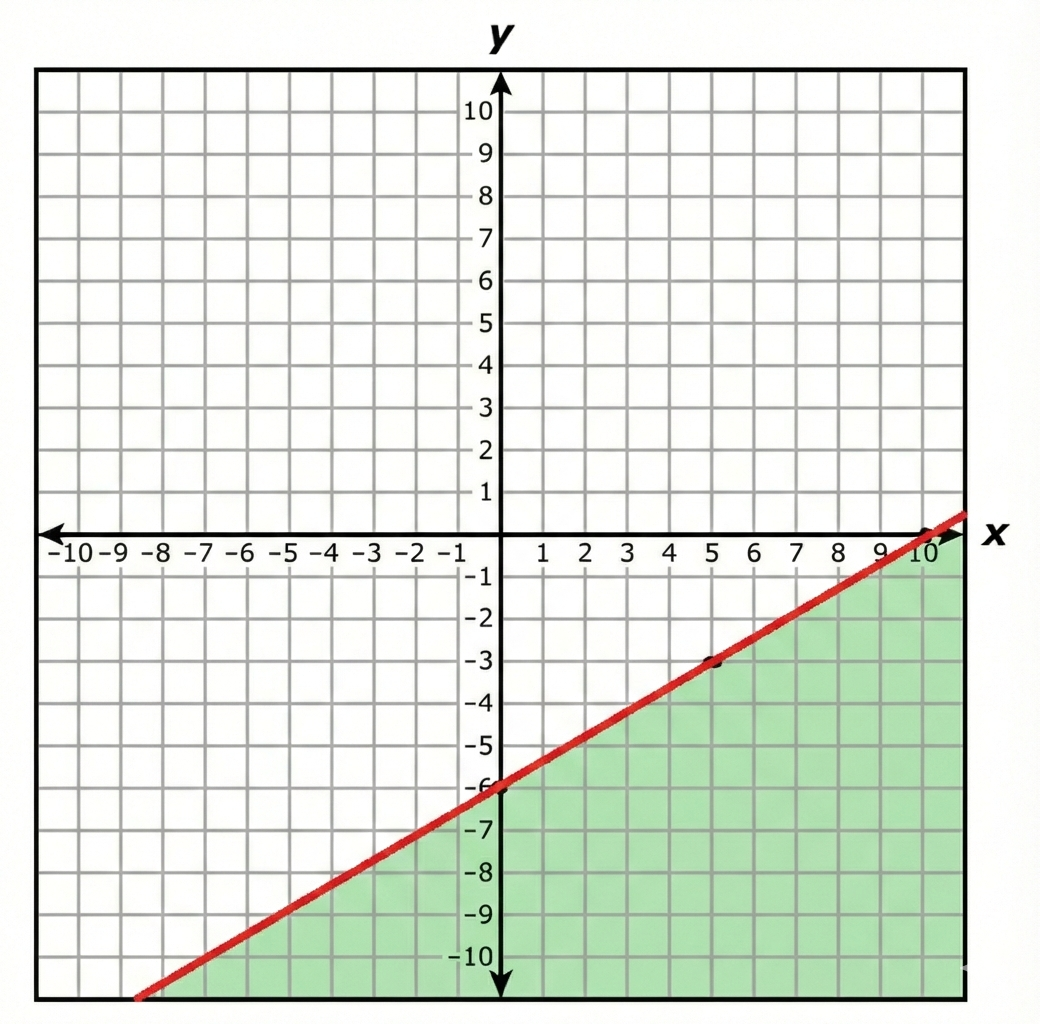
An ordered pair in the shaded region is in the solution set of the inequality.
Let us analyze each option.
Option A.
$(5, -4)$ is inside the solution set.
This is the correct answer.
But, let us analyze the remaining options if you wish.
Option B.
$(-2, -5)$ is outside the solution set.
Option C.
$(9, 1)$ is outside the solution set.
Option D.
$(-8, 3)$ is outside the solution set.
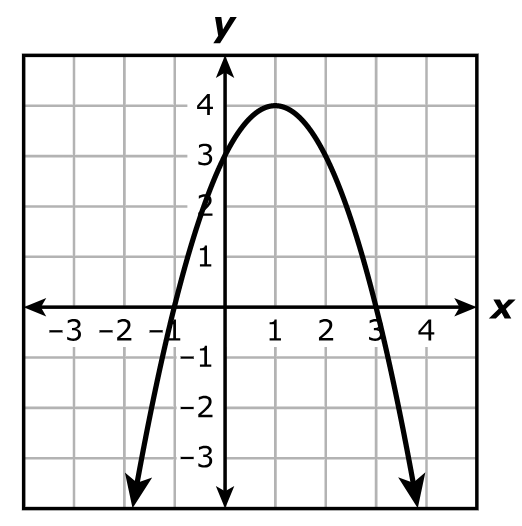
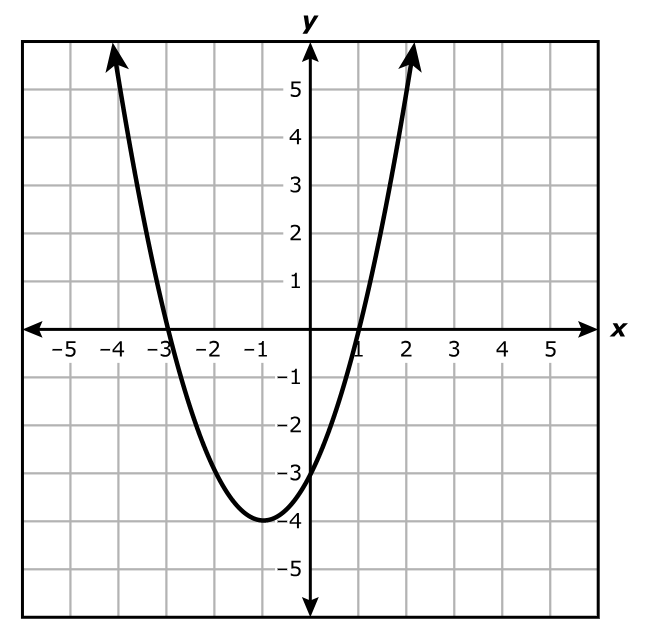
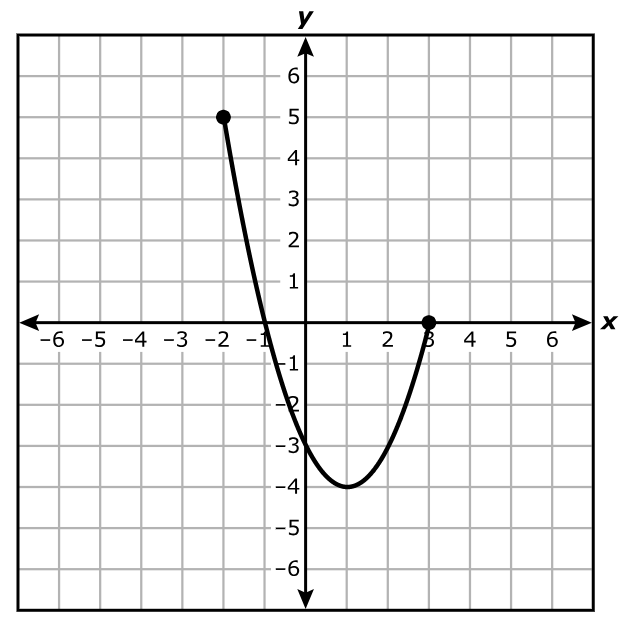
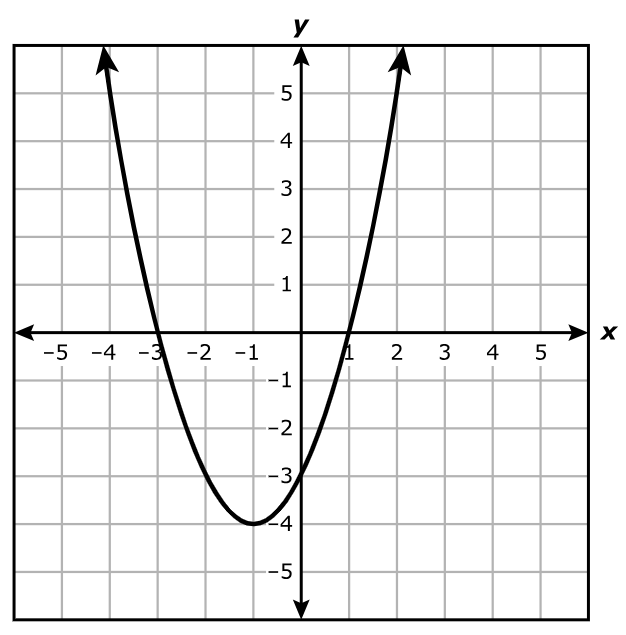
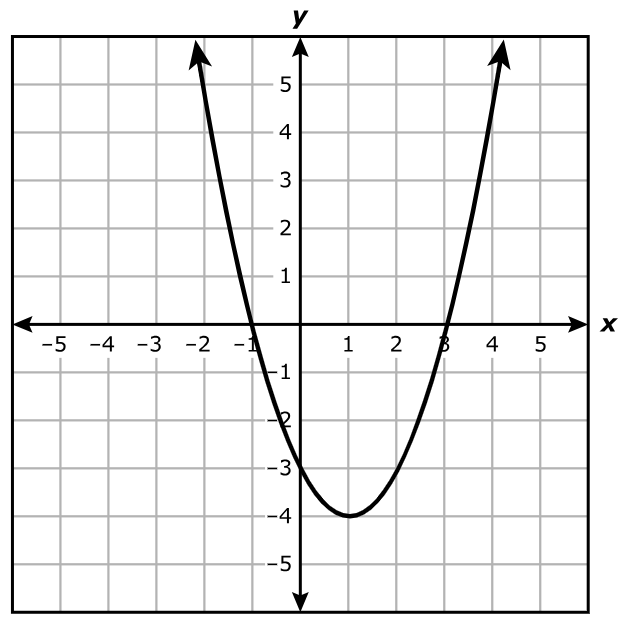
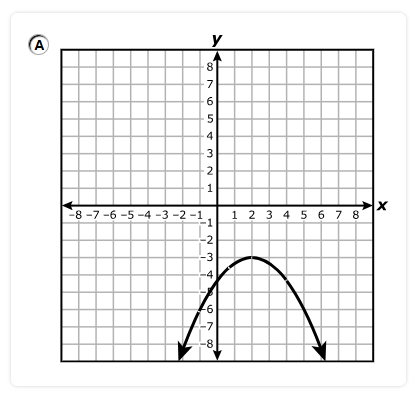
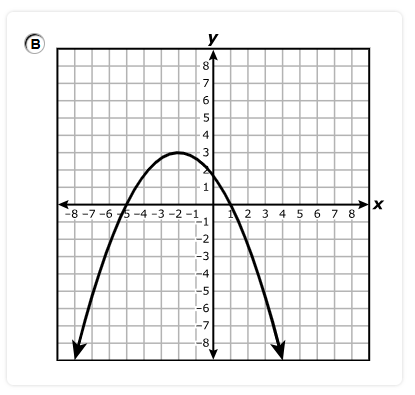
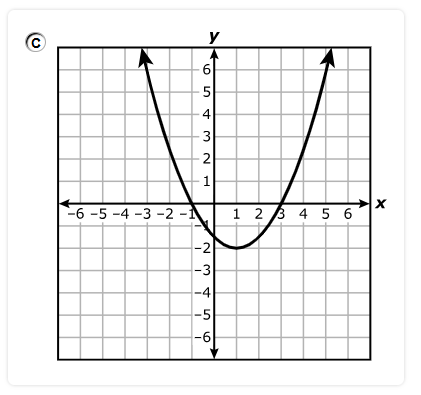
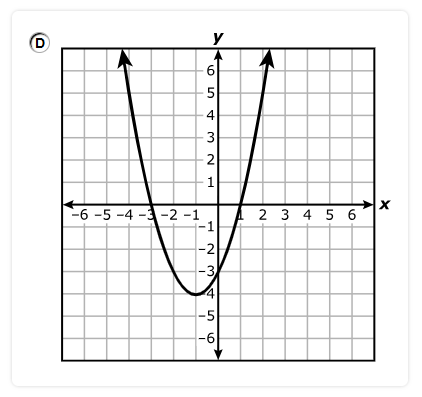
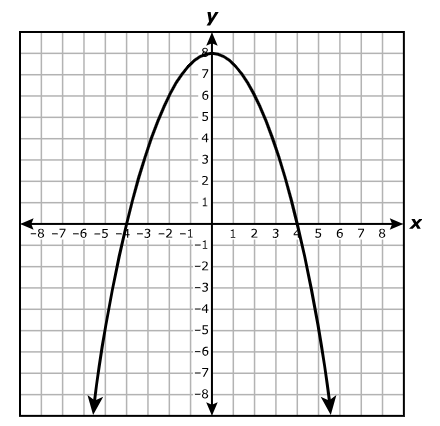
Which statement appears to be true?
A. The function has 3 zeros.
B. The maximum value of the function is 3.
C. The vertex of the graph of the function is (4, 1)
D. The equation of the axis of symmetry of the graph of the function is x = 1.
Let us analyze each option.
Option A.
A. The function has 3 zeros.
No, the function has 2 zeros.
B. The maximum value of the function is 3.
No, the maximum value of the function is 4.
C. The vertex of the graph of the function is (4, 1)
No, the vertex of the graph is (1, 4)
D. The equation of the axis of symmetry of the graph of the function is x = 1.
Yes, the equation of the axis of symmetry of the graph of the function is x = 1.
This is the correct answer.
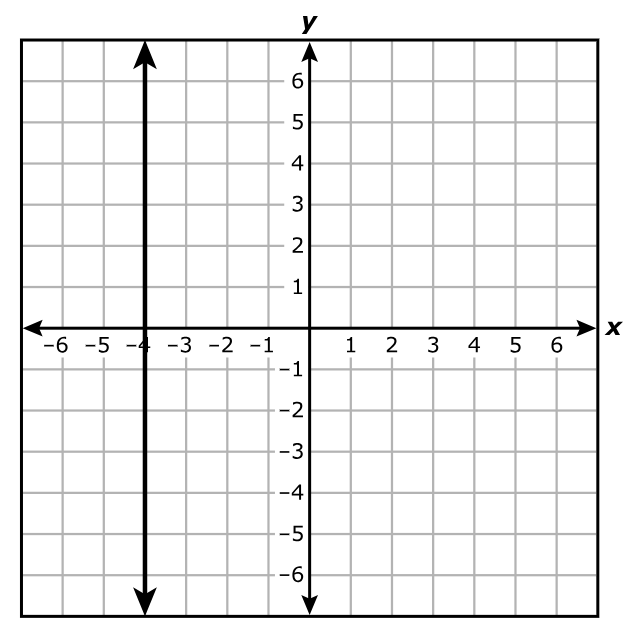
A. The equation of the line is x = –4, and the slope is undefined.
B. The equation of the line is y = –4, and the slope is equal to –4.
C. The equation of the line is x = –4, and the slope is equal to –4.
D. The equation of the line is y = –4, and the slope is undefined.
The slope of a vertical line is undefined.
Discard Options B. and D.
Options A. and C. remain.
The equation of the line is x = –4
Discard Option C.
The correct answer is Option A.
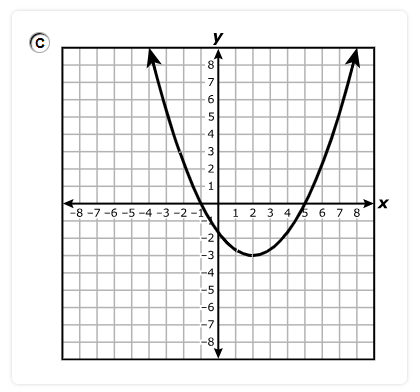
What is the zero of f?
$ A.\;\; -3 \\[3ex] B.\;\; 3 \\[3ex] C.\;\; 2 \\[3ex] D.\;\; -6 \\[3ex] $
$y = f(x)$
y is a function of x
The zero of the function is the value of x for which the function, y is zero.
$y = 0$ when $x = 2$
Hence, the zero of f is $x = 2$.
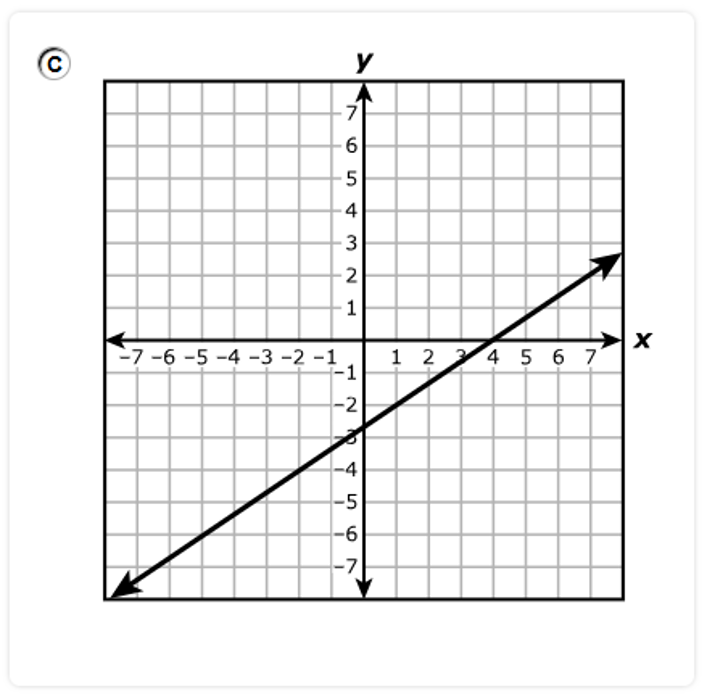
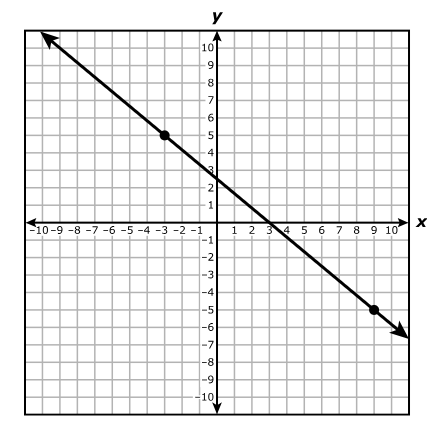
What is the slope of the line?
$ A.\;\; -\dfrac{2}{3} \\[5ex] B.\;\; \dfrac{3}{2} \\[5ex] C.\;\; \dfrac{2}{3} \\[5ex] D.\;\; -\dfrac{3}{2} \\[5ex] $
$ \text{slope} = m \\[3ex] \text{Point 1: } (-2, -2) \\[3ex] x_1 = -2 \\[3ex] y_1 = -2 \\[5ex] \text{Point 2: } (4, 2) \\[3ex] x_2 = 4 \\[3ex] y_2 = 2 \\[5ex] m = \dfrac{y_2 - y_1}{x_2 - x_1} \\[5ex] m = \dfrac{2 - (-2)}{4 - (-2)} \\[5ex] m = \dfrac{4}{6} \\[5ex] m = \dfrac{2}{3} $
The price of a discounted ticket was 80% of the price of a standard ticket.
There were 153 standard tickets sold at the baseball game.
There were 47 discounted tickets sold at the baseball game.
The total amount of ticket sales from the standard and discounted tickets was $2,649.34.
The line graphed on the grid represents the first equation in a system of linear equations for this situation.
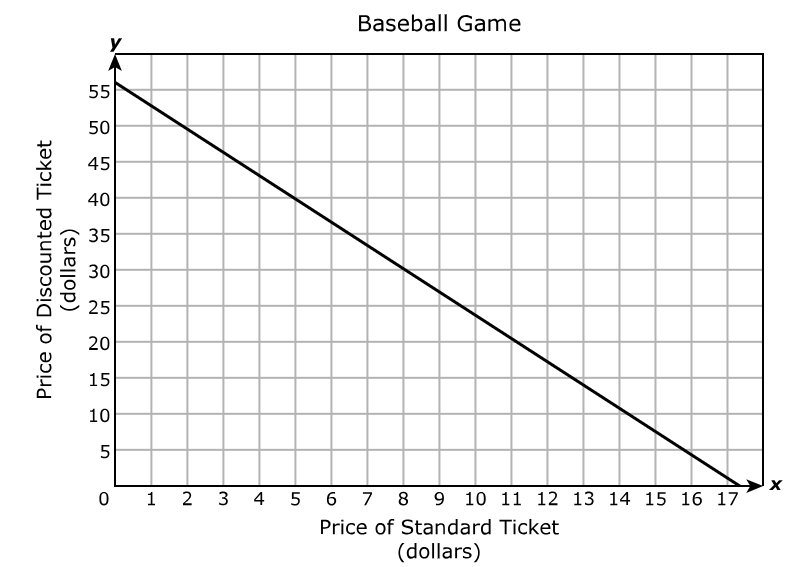
If the second equation in the system is $y = 0.80x$, what is the best estimate of the price of a discounted ticket?
$ A.\;\; \$13.95 \\[3ex] B.\;\; \$14.55 \\[3ex] C.\;\; \$13.25 \\[3ex] D.\;\; \$11.15 \\[3ex] $
The price of a discounted ticket was 80% of the price of a standard ticket.
80% = 0.8
If the second equation in the system is $y = 0.80x$
This implies that:
y = price of a discounted ticket
x = price of a standard ticket
There were 153 standard tickets sold at the baseball game.
Total cost for the standard tickets = 153x
There were 47 discounted tickets sold at the baseball game.
Total cost for the discounted tickets = 47y
The total amount of ticket sales from the standard and discounted tickets was $2,649.34.
This implies that:
$153x + 47y = 2649.34$
$ y = 0.8x...eqn.(1) \\[3ex] 153x + 47y = 2649.34...eqn.(2) \\[5ex] \underline{\text{Substitution Method}} \\[3ex] \text{Substitute for y in eqn.(2)} \\[3ex] 153x + 47(0.8x) = 2649.34 \\[3ex] 153x + 37.6x = 2649.34 \\[3ex] 190.6x = 2649.34 \\[3ex] x = \dfrac{2649.34}{190.6} \\[5ex] x = 13.9 \\[5ex] \text{Substitute for x in eqn.(1)} \\[3ex] y = 0.8(13.9) \\[3ex] y = 11.12 \\[3ex] $ The price of a discounted ticket is $11.12
The best estimate of the price of a discounted ticket is $11.15
Choose the correct value of the exponent for each term.
Move the correct answer to each box. Each answer may be used more than once. Not all answers will be used.
$ x^6y^3 \div \left(\dfrac{x^2}{y}\right) \\[5ex] x^6y^3 \cdot \left(\dfrac{y}{x^2}\right) \\[5ex] \text{DISSOCIATE} \\[3ex] x^6 \cdot y^3 \cdot y \cdot \dfrac{1}{x^2} \\[5ex] \dfrac{x^6}{x^2} \cdot y^3 \cdot y \\[5ex] \text{SOLVE} \\[3ex] x^{6 - 2} * y^{3 + 1} ...\text{Laws 1 and 2 Exp} \\[3ex] x^4 \cdot y^4 \\[3ex] \text{ASSOCIATE} \\[3ex] x^4y^4 $
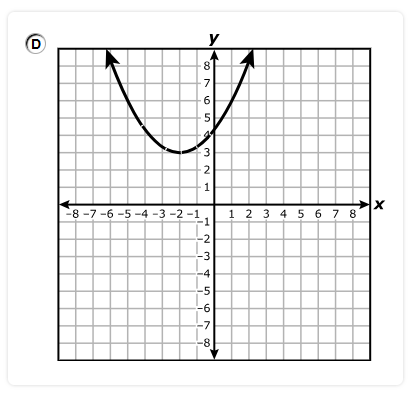
What are the coordinates of the vertex of the graph of g?
Move the correct answer to each box. Not all answeres will be used.
Parent Function: $f(x) = x^2$
Vertex = (0, 0)
Child Function: $g(x) = f(x - 3) - 9$
1st Transformation: Horizontal Shift 3 units to the right
$ (0, 0) \rightarrow (0 + 3, 0) \\[3ex] \hspace{2em} \rightarrow (3, 0) \\[3ex] $ 2nd Transformation: Vertical Shift 9 units down
$ (3, 0) \rightarrow (3, 0 - 9) \\[3ex] \hspace{2em} \rightarrow (3, -9) $
Graph the solution set of the linear inequality in the coordinate plane.
First, select the Graph button to graph the line and choose the line style.
To graph a line, select two points in the coordinate plane. A line will connect the points.
Then, select the Solution Set button to slect the desired region.
Because the inequality contains an equal sign, the line will be a solid line.
$ y \ge -x + 2 \\[5ex] \text{When } x = 0 \\[3ex] y \ge -0 + 2 \\[3ex] y \ge 2 \\[5ex] \text{When } x = 1 \\[3ex] y \ge -1 + 2 \\[3ex] y \ge 1 \\[3ex] $ The graph of the inequality is
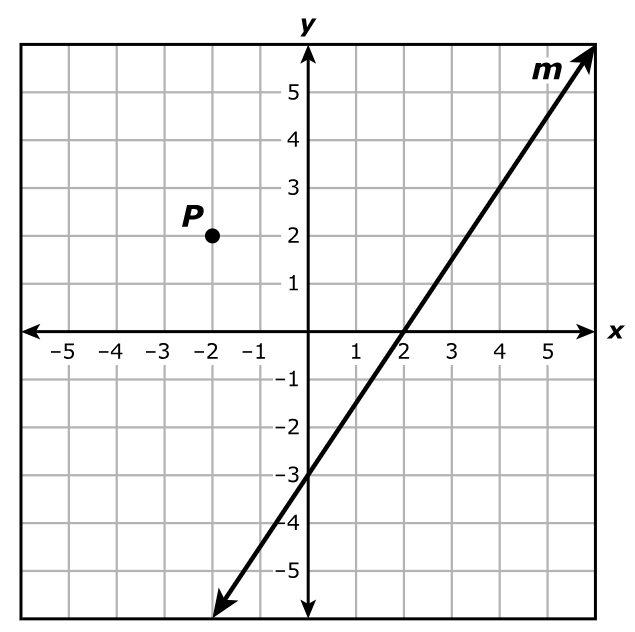
Which equation best represents the slope-intercept form of the line that passes through point P and is parallel to line m?
$ A.\;\; y = \dfrac{3}{2}x - 5 \\[5ex] B.\;\; y = -\dfrac{2}{3}x + \dfrac{2}{3} \\[5ex] C.\;\; y = \dfrac{3}{2}x + 5 \\[5ex] D.\;\; y = -\dfrac{2}{3}x - \dfrac{2}{3} \\[5ex] $
$ \underline{\text{Line m}} \\[3ex] \text{Point 1: } (0, -3) \\[3ex] x_1 = 0 \\[3ex] y_1 = -3 \\[5ex] \text{Point 2: } (2, 0) \\[3ex] x_2 = 2 \\[3ex] y_2 = 0 \\[5ex] m = \dfrac{y_2 - y_1}{x_2 - x_1} \\[5ex] m = \dfrac{0 - (-3)}{2 - 0} \\[5ex] m = \dfrac{3}{2} \\[5ex] \underline{\text{Line P}} \\[3ex] \text{Line P } || \text{ Line m} \\[3ex] m = \dfrac{3}{2}...\text{parallel lines have the same slope} \\[5ex] \text{Passes through Point } (-2, 2) \\[3ex] x_3 = -2 \\[3ex] y_3 = 2 \\[3ex] \text{Point–Slope Form} \\[3ex] y - y_3 = m(x - x_3) \\[3ex] y - 2 = \dfrac{3}{2}[x - (-2)] \\[5ex] y - 2 = \dfrac{3}{2}(x + 2) \\[5ex] \text{Slope–Intercept Form} \\[3ex] y = \dfrac{3}{2}(x + 2) + 2 \\[5ex] y = \dfrac{3}{2}x + 3 + 2 \\[5ex] y = \dfrac{3}{2}x + 5 $
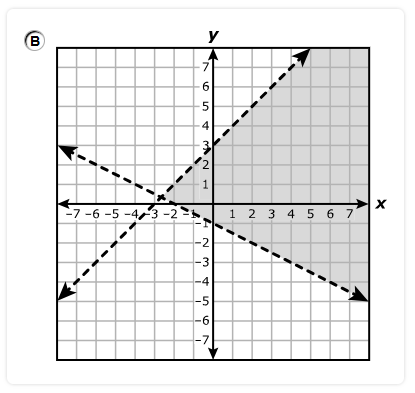
A.
B.
C.
D.
Let us analyze each option, and discard the incorrect ones.
$ \underline{\text{Option A.}} \\[3ex] x \lt 5 \\[3ex] y \gt \approx 3.2 \\[3ex] \text{Incorrect option} \\[5ex] \underline{\text{Option B.}} \\[3ex] x \gt 5 \\[3ex] y \lt 2 \\[3ex] \text{Correct option} \\[5ex] \underline{\text{Option C.}} \\[3ex] x \lt 5 \\[3ex] y \lt 2 \\[3ex] \text{Incorrect option} \\[5ex] \underline{\text{Option D.}} \\[3ex] x \gt 5 \\[3ex] y \gt 2 \\[3ex] \text{Incorrect option} $
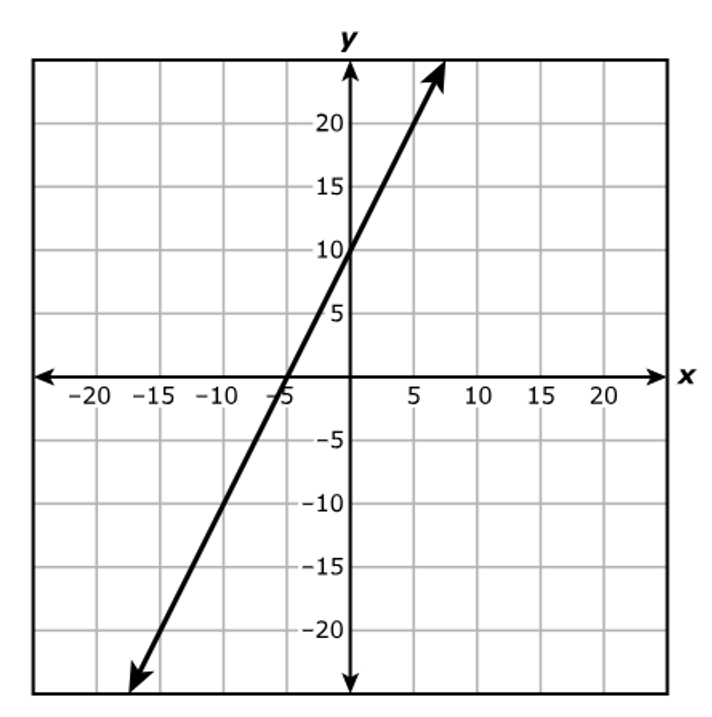
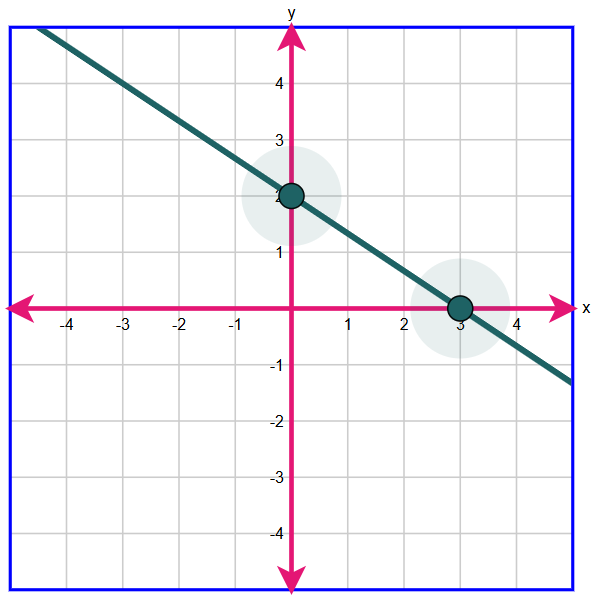
What are the x-intercept and the y-intercept of the line?
$ A.\;\; x-\text{intercept: } (8, 0) \\[3ex] \hspace{1.6em} y-\text{intercept: } (0, -2) \\[5ex] B.\;\; x-\text{intercept: } (-2, 0) \\[3ex] \hspace{1.6em} y-\text{intercept: } (0, 4) \\[5ex] C.\;\; x-\text{intercept: } (-2, 0) \\[3ex] \hspace{1.6em} y-\text{intercept: } (0, 8) \\[5ex] D.\;\; x-\text{intercept: } (4, 0) \\[3ex] \hspace{1.6em} y-\text{intercept: } (0, 8) \\[3ex] $
The x-intercept of the line is $(-2, 0)$
The y-intercept of the line is $(0, 8)$
Which values best represent the zeros of the function?
Select TWO correct answers.
The zeros of the function are the x-values where y is zero.
The zeros of the function are: $x = -1$ and $x = 3$
Whihc answer choice best represents the intercepts of the graph of r?
A. x-intercept: (5, 0)
y-intercepts: (0, 10) and (0, –2)
B. x-intercepts: (0, –10) and (0, 2)
y-intercept: (–5, 0)
C. x-intercept: (0, 5)
y-intercepts: (10, 0) and (–2, 0)
D. x-intercepts: (–10, 0) and (2, 0)
y-intercept: (0, –5)
The x-intercept is the point where the graph intersects the x-axis.
The graph intersects the x-axis at (–10, 0) and (2, 0)
Hence, the x-intercepts are (–10, 0) and (2, 0)
The y-intercept is the point where the graph intersects the y-axis.
The graph intersects the y-axis at (0, –5)
Hence, the y-intercept is (0, –5)
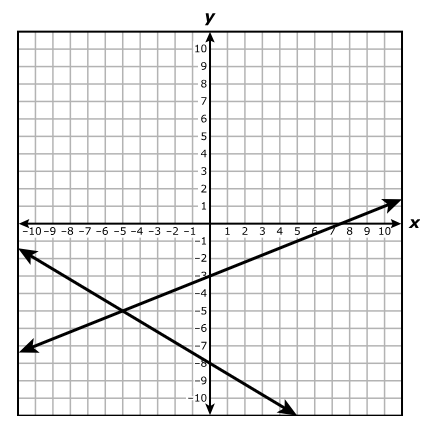
Which system of equations is best represented by the graph?
$ A.\;\; y = \dfrac{2}{5}x - 8 \\[5ex] \hspace{1.6em} y = -\dfrac{3}{5}x - 3 \\[5ex] B.\;\; y = \dfrac{2}{5}x - 3 \\[5ex] \hspace{1.6em} y = -\dfrac{3}{5}x - 8 \\[5ex] C.\;\; y = \dfrac{5}{2}x - 8 \\[5ex] \hspace{1.6em} y = -\dfrac{5}{3}x - 3 \\[5ex] D.\;\; y = \dfrac{5}{2}x - 3 \\[5ex] \hspace{1.6em} y = -\dfrac{5}{3}x - 8 \\[5ex] $
$ \text{slope} = m \\[3ex] \text{y-intercept} = b \\[5ex] \underline{\text{Line with the positive slope}} \\[3ex] \text{Point 1: } (0, -3) \\[3ex] x_1 = 0 \\[3ex] y_1 = -3 \\[5ex] \text{Point 2: } (5, -1) \\[3ex] x_2 = 5 \\[3ex] y_2 = -1 \\[5ex] m = \dfrac{y_2 - y_1}{x_2 - x_1} \\[5ex] m = \dfrac{-1 - (-3)}{5 - 0} \\[5ex] m = \dfrac{-1 + 3}{5} \\[5ex] m = \dfrac{2}{5} \\[5ex] \text{Slope–Intercept Form} \\[3ex] y = mx + b \\[3ex] b = -3 \\[3ex] \implies \\[3ex] y = \dfrac{2}{5}x - 3...eqn.(1) \\[5ex] \underline{\text{Line with the negative slope}} \\[3ex] \text{Point 1: } (-5, -5) \\[3ex] x_1 = -5 \\[3ex] y_1 = -5 \\[5ex] \text{Point 2: } (0, -8) \\[3ex] x_2 = 0 \\[3ex] y_2 = -8 \\[5ex] m = \dfrac{y_2 - y_1}{x_2 - x_1} \\[5ex] m = \dfrac{-8 - (-5)}{0 - (-5)} \\[5ex] m = \dfrac{-8 + 5}{0 + 5} \\[5ex] m = -\dfrac{3}{5} \\[5ex] \text{Slope–Intercept Form} \\[3ex] y = mx + b \\[3ex] b = -8 \\[3ex] \implies \\[3ex] y = -\dfrac{3}{5}x - 8...eqn.(2) \\[5ex] $ The system of equations best represented by the graph is:
$ B.\;\; y = \dfrac{2}{5}x - 3 \\[5ex] \hspace{1.6em} y = -\dfrac{3}{5}x - 8 $
A.
B.
C.
D.
The Vertical Line test states that if a vertical line is used to cut through the graph of a relation; the relation is a function if the vertical line intersects the graph at only one point, and the relation is not a function if the vertical line intersects the graph at more than one point.
Using the Vertical Line Test:
The only graph that passes the Vertical Line Test is the graph in Option D.
Option D. is the correct answer.
A.
B.
C.
D.
Let us analyze each option.
Option A.
The range is the set of all real numbers less than or equal to –3
Incorrect answer.
Option B.
The range is the set of all real numbers less than or equal to 3
Incorrect answer.
Option C.
The range is the set of all real numbers greater than or equal to –3
Incorrect answer.
Option D.
The range is the set of all real numbers greater than or equal to 3
Correct answer.
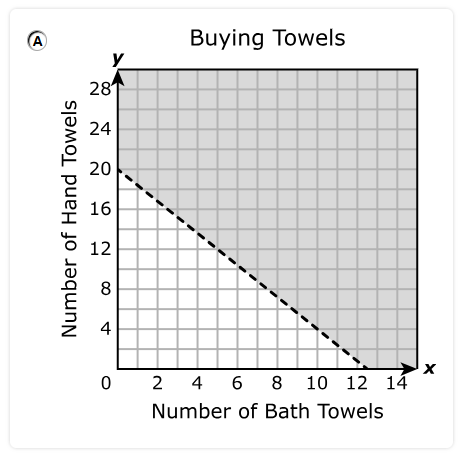
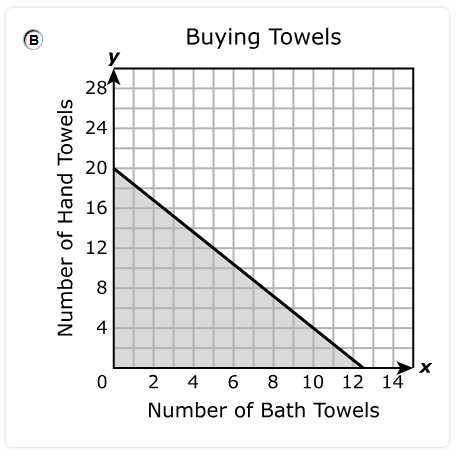
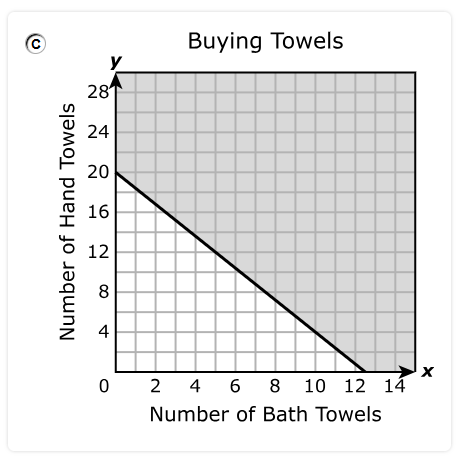
Each bath towel costs $8, and each hand towel costs $5.
The inequality $8x + 5y \le 100$ represents all possible combinations of x, the number of bath towels, and y, the number of hand towels the customer can buy.
Which graph best represents the solution set for this inequality?
A.
B.
C.
D.
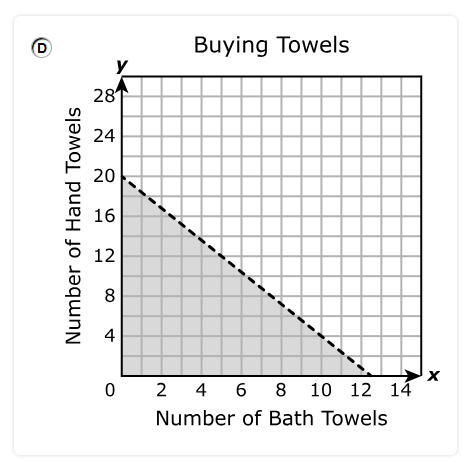
$ 8x + 5y \le 100 \\[3ex] \text{When } x = 0 \\[3ex] 8(0) + 5y \le 100 \\[3ex] 5y \le 100 \\[3ex] y \le \dfrac{100}{5} \\[5ex] y \le 20 ...\text{Mark point } (0, 20) \\[3ex] \text{The shaded area is downwards from } y = 20 \\[5ex] \text{When } y = 0 \\[3ex] 8x + 5(0) \le 100 \\[3ex] 8x \le 100 \\[3ex] x \le \dfrac{100}{8} \\[5ex] x \le 12.5 ...\text{Mark point } (12.5, 0) \\[3ex] \text{The shaded area is to the left of } x = 12.5 \\[3ex] $ Draw a straight solid line (because of the equal sign) connecting the two points: (0, 20) and (12.5, 0)
Shade the regions accordingly.
Locate the overlap of the two regions.
The correct answer is Option B.
Which function is best represented by the graph?
$ A.\;\; p(x) = (0.25)^x \\[3ex] B.\;\; p(x) = 2(0.5)^x \\[3ex] C.\;\; p(x) = (1.25)^x \\[3ex] D.\;\; p(x) = (25)^x \\[3ex] $
$ \underline{\text{Exponential Function}} \\[3ex] y = ab^x \\[3ex] a = \text{initial value} = \text{y-intercept} = 1 \\[3ex] b = \text{base} \\[3ex] \implies \\[3ex] y = b^x \\[5ex] \text{Passes through the point } (-2, 16) \\[3ex] y = 16 \\[3ex] x = -2 \\[3ex] 16 = b^{-2} \\[3ex] b^{-2 * -\dfrac{1}{2}} = 16^{-\dfrac{1}{2}} \\[7ex] b = \dfrac{1}{16^{\dfrac{1}{2}}}...\text{Law 6 Exp} \\[9ex] b = \dfrac{1}{\sqrt{16}} ...\text{Law 7 Exp} \\[5ex] b = \dfrac{1}{4} \\[5ex] b = 0.25 \\[3ex] \implies \\[3ex] y = (0.25)^x $
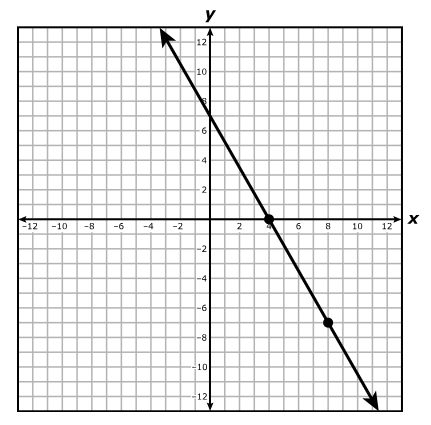
A table representing some points on line h and the graph of line j are shown.
| x | –16 | –8 | –4 | 12 |
| y | 7 | 1 | –2 | –14 |
Which system of equations is best represented by lines h and j?
$ A.\;\; y = \dfrac{4}{3}x - 5 \\[5ex] \hspace{1.6em} y = \dfrac{4}{5}x + 1 \\[5ex] B.\;\; y = \dfrac{3}{4}x - 5 \\[5ex] \hspace{1.6em} y = \dfrac{5}{4}x + 1 \\[5ex] C.\;\; y = -\dfrac{4}{3}x - 5 \\[5ex] \hspace{1.6em} y = -\dfrac{4}{5}x + 1 \\[5ex] D.\;\; y = -\dfrac{3}{4}x - 5 \\[5ex] \hspace{1.6em} y = -\dfrac{5}{4}x + 1 \\[5ex] $
$ \text{slope} = m \\[3ex] \text{y-intercept} = b \\[5ex] \underline{\text{Table}} \\[3ex] \text{Point 1: } (-16, 7) \\[3ex] x_1 = -16 \\[3ex] y_1 = 7 \\[5ex] \text{Point 2: } (12, -14) \\[3ex] x_2 = 12 \\[3ex] y_2 = -14 \\[5ex] m = \dfrac{y_2 - y_1}{x_2 - x_1} \\[5ex] m = \dfrac{-14 - 7}{12 - (-16)} \\[5ex] m = \dfrac{-21}{28} \\[5ex] m = -\dfrac{3}{4} \\[5ex] \text{Point – Slope Form} \\[3ex] y - y_1 = m(x - x_1) \\[3ex] y - 7 = -\dfrac{3}{4}[x - (-16)] \\[5ex] y - 7 = -\dfrac{3}{4}(x + 16) \\[5ex] \text{Slope–Intercept Form} \\[3ex] y = -\dfrac{3}{4}(x + 16) + 7 \\[5ex] y = -\dfrac{3}{4}x - 12 + 7 \\[5ex] y = -\dfrac{3}{4}x - 5...eqn.(1) \\[5ex] \underline{\text{Graph}} \\[3ex] \text{Point 1: } (-4, 6) \\[3ex] x_1 = -4 \\[3ex] y_1 = 6 \\[5ex] \text{Point 2: } (4, -4) \\[3ex] x_2 = 4 \\[3ex] y_2 = -4 \\[5ex] m = \dfrac{y_2 - y_1}{x_2 - x_1} \\[5ex] m = \dfrac{-4 - 6}{4 - (-4)} \\[5ex] m = \dfrac{-10}{8} \\[5ex] m = -\dfrac{5}{4} \\[5ex] \text{Slope – Intercept Form} \\[3ex] y = mx + b \\[3ex] b = 1 \\[3ex] \implies \\[3ex] y = -\dfrac{5}{4}x + 1...eqn.(2) \\[5ex] $ The system of equations best represented by the graph is:
$ D.\;\; y = -\dfrac{3}{4}x - 5 \\[5ex] \hspace{1.6em} y = -\dfrac{5}{4}x + 1 $
What is the value of k?
Record your answer in the boxes below.
$ d^2 - d - 6 \\[3ex] \text{Factors are: } 2 \text{ and } -3 \\[3ex] (d + 2)(d - 3) \\[3ex] \implies \\[3ex] k = -3 $
Which equation is best represented by this graph?
$ A.\;\; y = -\dfrac{7}{4}x + 4 \\[5ex] B.\;\; y = -\dfrac{7}{4}x + 7 \\[5ex] C.\;\; y = -\dfrac{4}{7}x + 4 \\[5ex] D.\;\; y = -\dfrac{4}{7}x + 7 \\[5ex] $
$ \text{slope} = m \\[3ex] \text{y-intercept} = b \\[5ex] \text{Point 1: } (4, 0) \\[3ex] x_1 = 4 \\[3ex] y_1 = 0 \\[5ex] \text{Point 2: } (8, -7) \\[3ex] x_2 = 8 \\[3ex] y_2 = -7 \\[5ex] m = \dfrac{y_2 - y_1}{x_2 - x_1} \\[5ex] m = \dfrac{-7 - 0}{8 - 4} \\[5ex] m = -\dfrac{7}{4} \\[5ex] b = 7 \\[5ex] \text{Slope–Intercept Form} \\[3ex] y = mx + b \\[3ex] y = -\dfrac{7}{4}x + 7 $
Each bouquet will have 9 flowers.
The graph shows the linear relationship between y, the number of flowers used, and x, the number of bouquets.
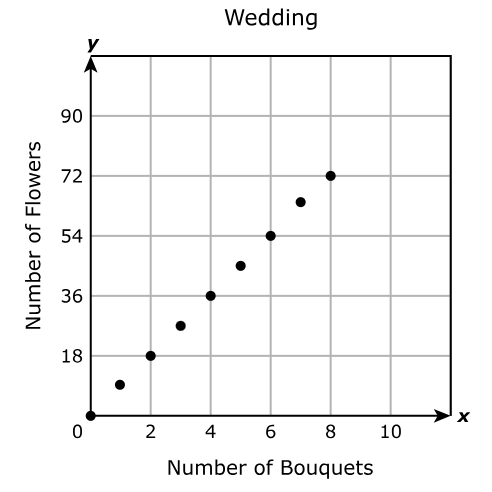
The florist will use no more than 8 bouquets for the wedding.
Which set best represents the domain of the function for this situation?
$ A.\;\; \{0, 2, 4, 6, 8, 10\} \\[3ex] B.\;\; \{0, 1, 2, 3, 4, 5, 6, 7, 8\} \\[3ex] C.\;\; \{0, 18, 36, 54, 72, 90\} \\[3ex] D.\;\; \{0, 9, 18, 27, 36, 45, 54, 63, 72\} \\[3ex] $
The domain is the set of all the input values, x for which the function has an output.
Based on the graph, the domain is: $\{0, 1, 2, 3, 4, 5, 6, 7, 8\}$
The coordinates of both points indicated on the graph of the line are integers.
What is the rate of change of y with respect to x for this line?
$ A.\;\; \dfrac{5}{2} \\[5ex] B.\;\; -\dfrac{6}{5} \\[5ex] C.\;\; \dfrac{2}{3} \\[5ex] D.\;\; -\dfrac{5}{6} \\[5ex] $
The rate of change of y with respect to x for this line is the slope of the line.
$ \text{Point 1: } (-3, 5) \\[3ex] x_1 = -3 \\[3ex] y_1 = 5 \\[5ex] \text{Point 2: } (9, -5) \\[3ex] x_2 = 9 \\[3ex] y_2 = -5 \\[5ex] \text{Slope, } m = \dfrac{y_2 - y_1}{x_2 - x_1} \\[5ex] m = \dfrac{-5 - 5}{9 - (-3)} \\[5ex] m = \dfrac{-10}{12} \\[5ex] m = -\dfrac{5}{6} $
Record your answer in the boxes below.
$ h(x) = 12.3(4.9)^x \\[3ex] y-\text{intercept} = h(0) \\[3ex] h(0) = 12.3(4.9)^0 \\[3ex] h(0) = 12.3(1)...\text{Law 3 Exp} \\[3ex] h(0) = 12.3 $
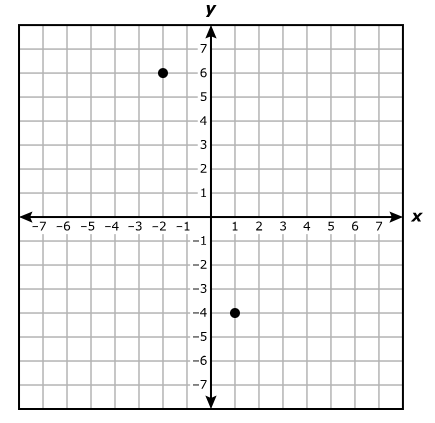
Which equation in slope-intercept form best represents the line that passes through these two points?
$ A.\;\; y = -\dfrac{2}{3}x - \dfrac{11}{3} \\[5ex] B.\;\; y = -\dfrac{11}{3}x - \dfrac{2}{3} \\[5ex] C.\;\; y = -\dfrac{2}{3}x - \dfrac{10}{3} \\[5ex] D.\;\; y = -\dfrac{10}{3}x - \dfrac{2}{3} \\[5ex] $
$ \text{Point 1: } (-2, 6) \\[3ex] x_1 = -2 \\[3ex] y_1 = 6 \\[5ex] \text{Point 2: } (1, -4) \\[3ex] x_2 = 1 \\[3ex] y_2 = -4 \\[5ex] \text{Slope, } m = \dfrac{y_2 - y_1}{x_2 - x_1} \\[5ex] m = \dfrac{-4 - 6}{1 - (-2)} \\[5ex] m = -\dfrac{10}{3} \\[5ex] \text{Point–Slope Form} \\[3ex] y - y_1 = m(x - x_1) \\[3ex] y - 6 = -\dfrac{10}{3}[x - (-2)] \\[5ex] y - 6 = -\dfrac{10}{3}(x + 2) \\[5ex] \text{Slope–Intercept Form} \\[3ex] y = -\dfrac{10}{3}(x + 2) + 6 \\[5ex] y = -\dfrac{10}{3}x - \dfrac{20}{3} + \dfrac{18}{3} \\[5ex] y = -\dfrac{10}{3}x - \dfrac{2}{3} $
Record your answer in the boxes below.
$ x^2 + 9x - 22 = 0 \\[3ex] \text{Factors are } 11 \text{ and } -2 \\[3ex] (x + 11)(x - 2) = 0 \\[3ex] x + 11 \text{ or } x - 2 = 0 ...\text{Zero Product Property} \\[3ex] x = -11 \text{ or } x = 2 \\[3ex] \text{Positive Solution} \\[3ex] x = 2 $
The scatterplot and table show the number of months since the start of the build and the percentage of the house still left to build.
A linear function can be used to model this relationship.
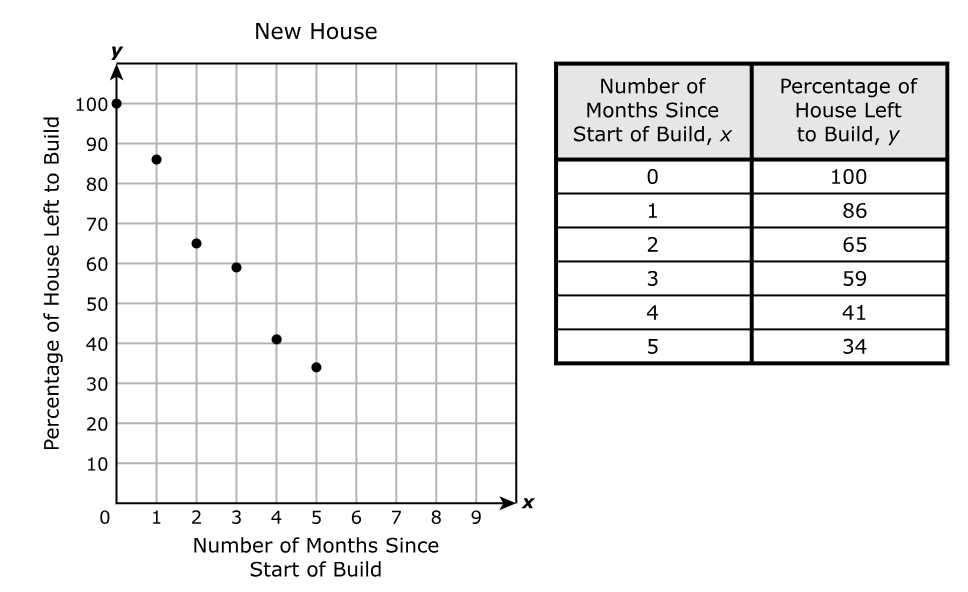
Which function best models the data?
$ A.\;\; y = -13.5x + 97.8 \\[3ex] B.\;\; y = -13.5x + 7.3 \\[3ex] C.\;\; y = 97.8x - 13.5 \\[3ex] D.\;\; y = 7.3x - 97.8 \\[3ex] $
$ \underline{\text{Linear Function}} \\[3ex] \text{slope} = m \\[3ex] \text{y-intercept} = b = 100 \\[5ex] \text{Point 1: } (0, 100) \\[3ex] x_1 = 0 \\[3ex] y_1 = 100 \\[5ex] \text{Point 2: } (5, 34) \\[3ex] x_2 = 5 \\[3ex] y_2 = 34 \\[5ex] m = \dfrac{y_2 - y_1}{x_2 - x_1} \\[5ex] m = \dfrac{34 - 100}{5 - 0} \\[5ex] m = \dfrac{-66}{5} \\[5ex] m = -13.5 \\[5ex] \text{Slope–Intercept Form} \\[3ex] y = mx + b \\[3ex] y = -13.5x + 100 \\[3ex] $ The closest answer (the function that best models the data) is: $y = -13.5x + 97.8$
A.
B.
C.
D.
We can solve this question using at least two approaches.
Use any approach you prefer.
$ \text{1st Approach: Slope–Intercept Form} \\[3ex] y = mx + b \\[3ex] \text{slope} = m \\[3ex] \text{y-intercept} = b \\[5ex] y = -4(x + 3) - 2 \\[3ex] y = -4x - 12 - 2 \\[3ex] y = -4x - 14 \\[3ex] m = -4 \\[3ex] b = -14 \\[3ex] $ The slope is negative.
Options A. and B. are discarded.
Options C. and D. remain.
We cannot verify the y-intercept.
So, let us verify a point.
$ y = -4x - 14 \\[3ex] \text{When } y = 2 \\[3ex] 2 = -4x - 14 \\[3ex] 4x = -14 - 2 \\[3ex] 4x = -16 \\[3ex] x = -\dfrac{16}{4} \\[5ex] x = -4 \\[3ex] $ Option D. is discarded.
Option C. is the answer.
$ \text{2nd Approach: Tranformation of Functions} \\[3ex] \underline{\text{Parent Function}} \\[3ex] y = x \\[3ex] \text{Coordinate} = (0, 0) \\[5ex] \underline{\text{Child Function}} \\[3ex] y = -4(x + 3) - 2 \\[5ex] \underline{\text{Transformations}} \\[3ex] x + 3 \implies \text{Horizontal Shift 3 units to the left} \\[3ex] (0, 0) \rightarrow (0 - 3, 0) \\[3ex] \hspace{2.5em} \rightarrow (-3, 0) \\[5ex] 4(x + 3) \implies \text{Vertical Shift by a factor of 4 units} \\[3ex] (-3, 0) \rightarrow (-3, 4 * 0) \\[3ex] \hspace{3em} \rightarrow (-3, 0) \\[5ex] -4(x + 3) \implies \text{Vertical Reflection} \\[3ex] (-3, 0) \rightarrow (-3, -1 * 0) \\[3ex] \hspace{3em} \rightarrow (-3, 0) \\[5ex] -4(x + 3) - 2 \implies \text{Vertical Shift 2 units down} \\[3ex] (-3, 0) \rightarrow (-3, 0 - 2) \\[3ex] \hspace{3em} \rightarrow (-3, -2) \\[3ex] $ Which of the graphs have a line that passes through $(-3, -2)$?
Options A. and D. are discarded because the lines do not pass through that point.
Options B. and C. remain.
Let us test another coordinate.
$ \text{Coordinate on Parent Function} = (1, 1) \\[5ex] \text{Horizontal Shift 3 units to the left} \\[3ex] (1, 1) \rightarrow (1 - 3, 1) \\[3ex] \hspace{2.5em} \rightarrow (-2, 1) \\[5ex] \text{Vertical Shift by a factor of 4 units} \\[3ex] (-2, 1) \rightarrow (-2, 4 * 1) \\[3ex] \hspace{3em} \rightarrow (-2, 4) \\[5ex] \text{Vertical Reflection} \\[3ex] (-2, 4) \rightarrow (-2, -1 * 4) \\[3ex] \hspace{3em} \rightarrow (-2, -4) \\[5ex] \implies \text{Vertical Shift 2 units down} \\[3ex] (-2, -4) \rightarrow (-2, -4 - 2) \\[3ex] \hspace{3em} \rightarrow (-2, -6) \\[3ex] $ Which of the graphs in Options B. and C. have a line that passes through $(-3, -2)$?
Option B. is discarded.
Option C. is the correct answer.
| Time (seconds) | Distance Below Sea Level (feet) |
|---|---|
| 0 | 460 |
| 18 | 604 |
| 34 | 732 |
| 52 | 876 |
| 70 | 1,020 |
What is the rate of change of the distance in feet below sea level with respect to time that the submarine traveled?
Record your answer in the boxes below.
x = Time (seconds)
y = Distance Below Sea Level (feet)
The rate of change of of the distance in feet below sea level with respect to time is the slope of the graph.
$ \text{Point 1: } (0, 460) \\[3ex] x_1 = 0 \\[3ex] y_1 = 460 \\[5ex] \text{Point 2: } (70, 1020) \\[3ex] x_2 = 70 \\[3ex] y_2 = 1020 \\[5ex] \text{Slope, } m = \dfrac{y_2 - y_1}{x_2 - x_1} \\[5ex] m = \dfrac{1020 - 460}{70 - 0} \\[5ex] m = -\dfrac{560}{70} \\[5ex] m = 8 $ The rate of change of of the distance in feet below sea level with respect to time that the submarine traveled is 8 feet per seconds.
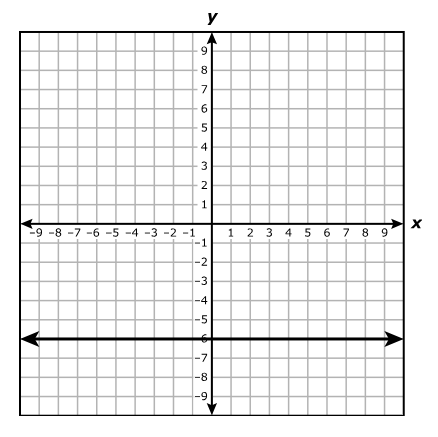
$ A.\;\; y = 0 \\[3ex] B.\;\; y = -6 \\[3ex] C.\;\; x = 0 \\[3ex] D.\;\; x = -6 \\[3ex] $
The equation of the line is: $y = -6$
Which ordered pair is in the solution set of $y \gt -\dfrac{1}{6}x - 4$?
$ A.\;\; (-8, 8) \\[3ex] B.\;\; (6, -5) \\[3ex] C.\;\; (4, -6) \\[3ex] D.\;\; (-2, -7) \\[3ex] $
The line is a dashed line (because there is no equality sign).
The area above the line is shaded. (because of the greater than sign)
An ordered pair in the shaded region (the region above the line) is in the solution set of the inequality.
Let us analyze each option.
Option A.
$(-8, 8)$ is in the region above the line.
This is the correct answer.
But, let us analyze the remaining options if you wish.
Option B.
$(6, -5)$ is in the line.
This is incorrect because the line is a dashed line.
Option C.
$(4, -6)$ is in the region below the line.
Option D.
$(-2, -7)$ is in the region below the line.
The graph shows the linear relationship between y, the temperature in degrees Fahrenheit, and x, the temperature in degrees Celsius from the freezing point of water.
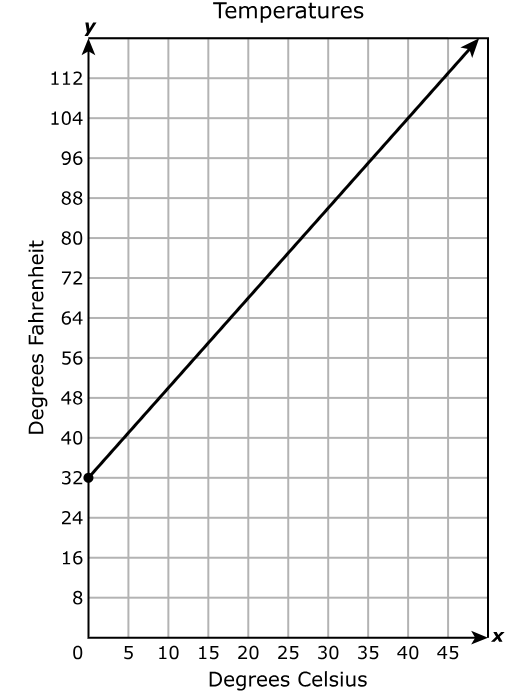
Which equation best represents this situation?
$ A.\;\; y = \dfrac{5}{9}x \\[5ex] B.\;\; y = \dfrac{9}{5}x \\[5ex] C.\;\; y = \dfrac{5}{9}x + 32 \\[5ex] D.\;\; y = \dfrac{9}{5}x + 32 \\[5ex] $
$ \underline{\text{Linear Function}} \\[3ex] \text{slope} = m \\[3ex] \text{y-intercept} = b \\[5ex] \text{Point 1: } (0, 32) \\[3ex] x_1 = 0 \\[3ex] y_1 = 32 \\[5ex] \text{Point 2: } (40, 104) \\[3ex] x_2 = 40 \\[3ex] y_2 = 104 \\[5ex] m = \dfrac{y_2 - y_1}{x_2 - x_1} \\[5ex] m = \dfrac{104 - 32}{40 - 0} \\[5ex] m = \dfrac{72}{40} \\[5ex] m = \dfrac{9}{5} \\[5ex] b = 32 \\[5ex] \text{Slope–Intercept Form} \\[3ex] y = mx + b \\[3ex] y = \dfrac{9}{5}x + 32 \\[3ex] $
A.

B.
C.
D.
$ \underline{\text{Inequality 1}} \\[3ex] \text{This is a dashed line because of the absence of the equality sign} \\[3ex] x + 2y \lt -2 \\[5ex] \text{When } x = 0 \\[3ex] 0 + 2y \lt -2 \\[3ex] 2y \lt -2 \\[3ex] y \lt -\dfrac{2}{2} \\[5ex] y \lt -1 \\[5ex] \text{When } y = 0 \\[3ex] x + 2(0) \lt -2 \\[3ex] x + 0 \lt -2 \\[3ex] x \lt -2 \\[5ex] \underline{\text{Inequality 2}} \\[3ex] \text{This is a dashed line because of the absence of the equality sign} \\[3ex] y - x \lt 3 \\[5ex] \text{When } x = 0 \\[3ex] y - 0 \lt 3 \\[3ex] y \lt 3 \\[5ex] \text{When } y = 0 \\[3ex] 0 - x \lt 3 \\[3ex] -x \lt 3 \\[3ex] x \gt \dfrac{3}{-1} \\[5ex] x \gt -3 \\[3ex] $ To graph a system of inequalities, each inequality is shaded and the solution is where the shaded regions overlap.
The correct answer is Option C.
A.
B.
C.
D.
$ \text{Zeros of } h(x) \\[3ex] h(x) = (x + 1)(x - 3) = 0 \\[3ex] x + 1 = 0 \text{ or } x - 3 = 0 \\[3ex] x = -1 \text{ or } x = 3 \\[3ex] $ Options B. and D. are discarded.
Options A. and C. remain.
$ \text{Vertex of } h(x) \\[3ex] h(x) = (x + 1)(x - 3) \\[3ex] h(x) = x^2 - 3x + x - 3 \\[3ex] h(x) = x^2 - 2x - 3 \\[3ex] \text{Compare to the standard form: } ax^2 + bx + c = 0 \\[3ex] a = 1 \\[3ex] b = -2 \\[3ex] x-\text{coordinate of the Vertex} = -\dfrac{b}{2a} \\[5ex] = \dfrac{-(-2)}{2(1)} \\[5ex] = \dfrac{2}{2} \\[5ex] = 1 \\[3ex] y-\text{coordinate of the Vertex} = h(1) \\[3ex] = 1^2 - 2(1) - 3 \\[3ex] = 1 - 2 - 3 \\[3ex] = -4 \\[3ex] \text{Vertex} = (1, -4) \\[3ex] $ Option C. is discarded.
Option A. is the correct answer.
Record your answer in the boxes below.
$ 4(q + 56.5) = 30q - 112 \\[3ex] 4q + 226 = 30q - 112 \\[3ex] 226 + 112 = 30q - 4q \\[3ex] 338 = 26q \\[3ex] 26q = 338 \\[3ex] q = \dfrac{338}{26} \\[5ex] q = 13 $
A.
B.
C.
D.
$ \text{Equation 1} \\[3ex] 2x = 6 - y \\[3ex] \text{When } x = 0 \\[3ex] 2(0) = 6 - y \\[3ex] 0 = 6 - y \\[3ex] y = 6 - 0 \\[3ex] y = 6 \\[3ex] (x, y) = (0, 6) \\[5ex] \text{When } y = 0 \\[3ex] 2x = 6 - 0 \\[3ex] 2x = 6 \\[3ex] x = \dfrac{6}{2} \\[5ex] x = 3 \\[3ex] (x, y) = (3, 0) \\[5ex] \text{Equation 2} \\[3ex] 5x - 4y = 28 \\[3ex] \text{When } x = 0 \\[3ex] 5(0) - 4y = 28 \\[3ex] -4y = 28 \\[3ex] y = \dfrac{28}{-4} \\[5ex] y = -7 \\[3ex] (x, y) = (0, -7) \\[5ex] \text{When } y = 3 \\[3ex] 5x - 4(3) = 28 \\[3ex] 5x - 12 = 28 \\[3ex] 5x = 28 + 12 \\[3ex] 5x = 40 \\[3ex] x = \dfrac{40}{5} \\[5ex] x = 8 \\[3ex] (x, y) = (8, 3) \\[3ex] $ The correct answer is Option B.
A.
B.
C.
D.
The domain is the set of all the input values, x for which the function has an output.
Let us analyze each option and discard the incorrect ones.
Option A.
The domain is the set of all real numbers less than 0
Discard.
Option B.
The domain is the set of all real numbers greater than –4.
Discard.
Option C.
The domain is the set of all real numbers less than –4
This is the correct option.
Option D.
The domain is the set of all real numbers greater than 0
Discard.
What is the slope of the line?
$ A.\;\; \dfrac{9}{2} \\[5ex] B.\;\; \dfrac{7}{8} \\[5ex] C.\;\; -\dfrac{9}{2} \\[5ex] D.\;\; -\dfrac{7}{8} \\[5ex] $
$ \text{Point 1: } (-3, 1) \\[3ex] x_1 = -3 \\[3ex] y_1 = 1 \\[5ex] \text{Point 2: } (5, 8) \\[3ex] x_2 = 5 \\[3ex] y_2 = 8 \\[5ex] \text{Slope, } m = \dfrac{y_2 - y_1}{x_2 - x_1} \\[5ex] m = \dfrac{8 - 1}{5 - (-3)} \\[5ex] m = \dfrac{7}{8} $
The graph of p was transformed to create the graph of q.
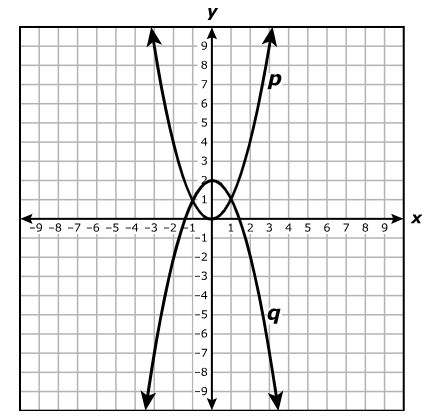
Which function best represents the graph of q?
$ A.\;\; q(x) = -(x - 2)^2 \\[3ex] B.\;\; q(x) = -(x + 2)^2 \\[3ex] C.\;\; q(x) = -x^2 - 2 \\[3ex] D.\;\; q(x) = -x^2 + 2 \\[3ex] $
$ \text{Graph of } p \\[3ex] \text{Parent Function: } p(x) = x^2 \\[3ex] \text{Vertex} = (0, 0) \\[5ex] \text{Graph of } q \\[3ex] \text{Transformations of Parent Function to give Child Function} \\[3ex] \text{1st: Vertical Reflection} \\[3ex] q(x) = -x^2 \\[3ex] (0, 0) \rightarrow (0, -1 * 0) \\[3ex] \hspace{2em} \rightarrow (0, 0) \\[5ex] \text{2nd: Vertical Shift 2 units up} \\[3ex] q(x) = -x^2 + 2 \\[3ex] (0, 0) \rightarrow (0, 0 + 2) \\[3ex] \hspace{2em} \rightarrow (0, 2) \\[3ex] $ The function that best represents the graph of q is $q(x) = -x^2 + 2$
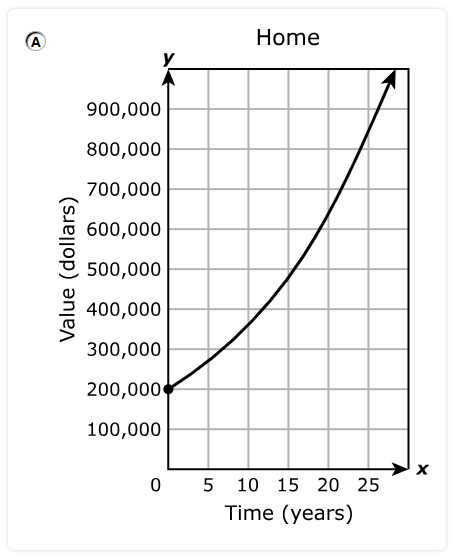
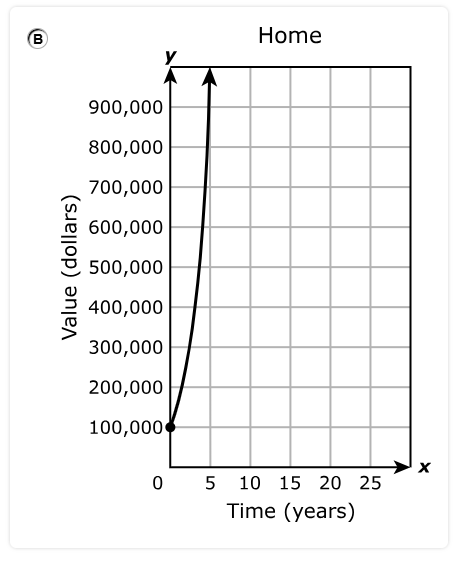
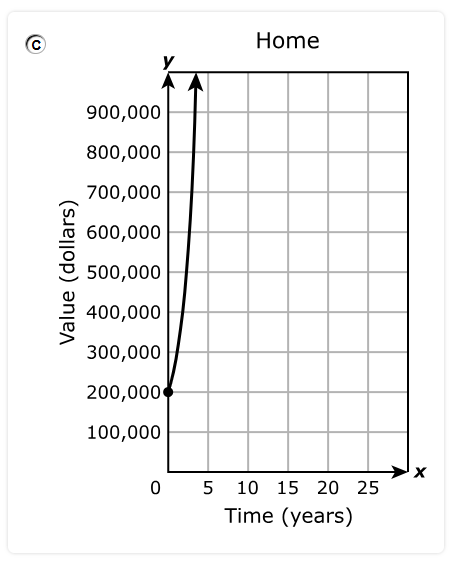
The value of the home will increase at a rate of 6% each year.
Which graph best models this situation?
A.
B.
C.
D.
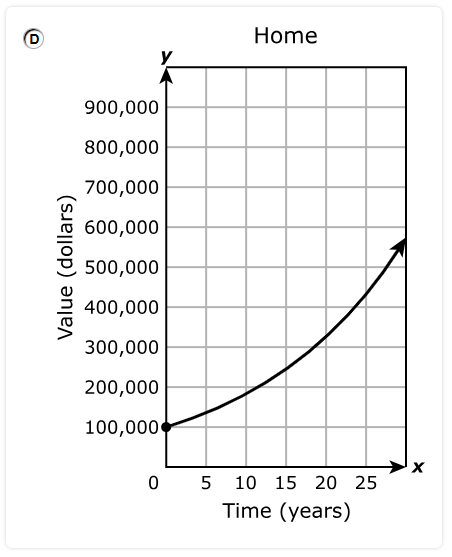
Let us analyze the options.
The initial value is $200,000
Options B. and D. are discarded because the initial value for those graphs is $100,000
Options A. and C. remain.
$ \underline{\text{Exponential Growth Function}} \\[3ex] y = a(1 + r)^x \\[3ex] a = \text{initial value} = \$200,000 \\[3ex] r = \text{growth rate} = 6\% = \dfrac{6}{100} = 0.06 \\[5ex] \implies \\[3ex] y = 200000(1 + 0.06)^x \\[3ex] y = 200000(1.06)^x \\[5ex] \text{When } x = 5 \text{ years} \\[3ex] y = 200000(1.06)^5 \\[3ex] y = \$267645.1155 \\[3ex] $ Option C. is discarded.
Option A. is the correct answer.
The coach will give each player on the team 8 golf balls.
The graph shows the linear relationship between y, the number of golf balls remaining for the team, and x, the number of players on the team.
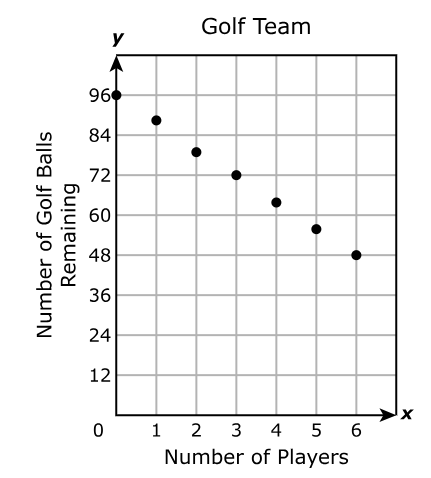
The coach will use no more than 6 players on the school's golf team.
Which set best represents the range of the function for this situation?
$ A.\;\; \{96, 84, 72, 60, 48, 36, 24\} \\[3ex] B.\;\; \{8, 9, 10, 11, 12, 13, 14\} \\[3ex] C.\;\; \{96, 88, 80, 72, 64, 56, 48\} \\[3ex] D.\;\; \{0, 1, 2, 3, 4, 5, 6\} \\[3ex] $
The range is the set of all the output values, y produced by the input values of the function.
From the graph, the range is $\{96, 88, 80, 72, 64, 56, 48\}$
Which graph best represents k?
A.
B.
C.
D.
Let us analyze each option.
Option A.
Zero: x = 3
y-intercept = 6 Discard.
Option B.
Zero: x = –2
y-intercept = 6 This is the correct answer.
Option C.
Zero: x = 6
y-intercept = –2 Discard.
Option D.
Zero: x = –6
y-intercept = –2 Discard.
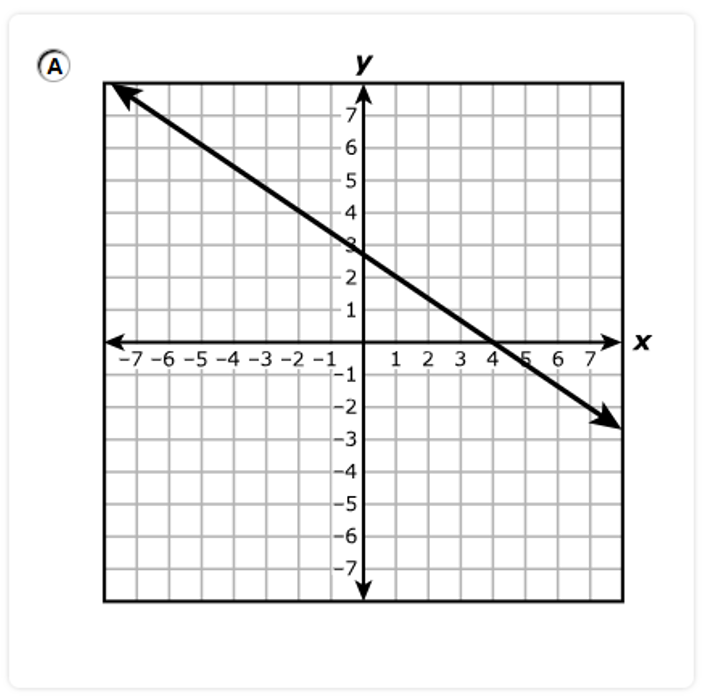
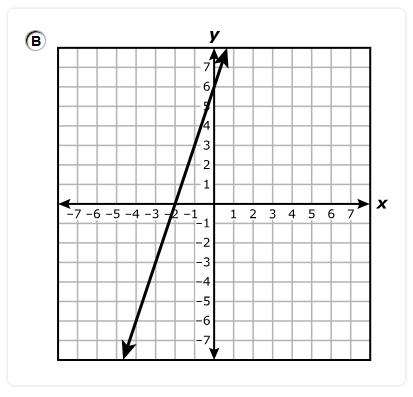
Which function is best represented by this graph?
$ A.\;\; g(x) = 6x + 4 \\[3ex] B.\;\; g(x) = 4x - \dfrac{2}{3} \\[5ex] C.\;\; g(x) = -\dfrac{3}{2}x + 6 \\[5ex] D.\;\; g(x) = -\dfrac{2}{3}x + 4 \\[5ex] $
$ m = \text{slope} \\[3ex] b = y-\text{intercept} = 4 \\[5ex] \text{Point 1: } (0, 4) \\[3ex] x_1 = 0 \\[3ex] y_1 = 4 \\[5ex] \text{Point 2: } (6, 0) \\[3ex] x_2 = 6 \\[3ex] y_2 = 0 \\[5ex] m = \dfrac{y_2 - y_1}{x_2 - x_1} \\[5ex] m = \dfrac{0 - 4}{6 - 0} \\[5ex] m = \dfrac{-4}{6} \\[5ex] m = -\dfrac{2}{3} \\[5ex] \text{Slope–Intercept Form} \\[3ex] y = mx + b \\[3ex] y = -\dfrac{2}{3}x + 4 \\[5ex] g(x) = -\dfrac{2}{3}x + 4 $
$ A.\;\; (0, 2) \\[3ex] B.\;\; (-3, 5) \\[3ex] C.\;\; (-1, 1) \\[3ex] D.\;\; (4, 0) \\[3ex] $
There are at least two approaches to solving this question.
Use any approach you prefer.
1st Approach: Algebraic Solution
This involves checking each option to see the one that satisfies the inequality.
$ 8x + 16y \gt 32 \\[5ex] \text{Option A.} \\[3ex] (0, 2) \\[3ex] x = 0 \\[3ex] y = 2 \\[3ex] 8(0) + 16(2) \stackrel{?}{\gt} 32 \\[3ex] 0 + 32 \stackrel{?}{\gt} 32 \\[3ex] 32 = 32 \\[3ex] 32 \ngtr 32 \\[3ex] \text{Discard}. \\[5ex] \text{Option B.} \\[3ex] (-3, 5) \\[3ex] x = -3 \\[3ex] y = 5 \\[3ex] 8(-3) + 16(5) \stackrel{?}{\gt} 32 \\[3ex] -24 + 80 \stackrel{?}{\gt} 32 \\[3ex] 56 \gt 32 \\[3ex] \text{This is the correct answer}. \\[5ex] \text{Option C.} \\[3ex] (-1, 1) \\[3ex] x = -1 \\[3ex] y = 1 \\[3ex] 8(-1) + 16(1) \stackrel{?}{\gt} 32 \\[3ex] -8 + 16 \stackrel{?}{\gt} 32 \\[3ex] 8 \ngtr 32 \\[3ex] \text{Discard}. \\[5ex] \text{Option D.} \\[3ex] (4, 0) \\[3ex] x = 4 \\[3ex] y = 0 \\[3ex] 8(4) + 16(0) \stackrel{?}{\gt} 32 \\[3ex] 32 + 0 \stackrel{?}{\gt} 32 \\[3ex] 32 = 32 \\[3ex] 32 \ngtr 32 \\[3ex] \text{Discard}. \\[3ex] $ 2nd Approach: Graphical Solution
They gave us a graph, so apparently, they want us to graph the inequality and use that graph in determining the solution.
Because the inequality does not contain an equal sign, the line will be a dashed line.
$ 8x + 16y \gt 32 \\[5ex] \text{When } x = 0 \\[3ex] 8(0) + 16y \gt 32 \\[3ex] 0 + 16y \gt 32 \\[3ex] 16y \gt 32 \\[3ex] y \gt \dfrac{32}{16} \\[5ex] y \gt 2 \\[5ex] \text{When } x = -2 \\[3ex] 8(-2) + 16y \gt 32 \\[3ex] -16 + 16y \gt 32 \\[3ex] 16y \gt 32 + 16 \\[3ex] 16y \gt 48 \\[3ex] y \gt \dfrac{48}{16} \\[5ex] y \gt 3 \\[5ex] \text{When } y = 0 \\[3ex] 8x + 16y \gt 32 \\[3ex] 8x + 16(0) \gt 32 \\[3ex] 8x \gt 32 \\[3ex] x \gt \dfrac{32}{8} \\[5ex] x \gt 4 \\[3ex] $ The graph of the inequality is:
An ordered pair in the shaded region is in the solution set of the inequality.
Let us analyze each option.
Option A.
$(0, 2)$ is on the dashed line.
Because it is a dashed line (not a solid line because there is no equal sign), this is outside the solution set.
Option B.
$(-3, 5)$ is inside the solution set.
But, let us analyze the remaining options if you wish.
Option C.
$(-1, 1)$ is outside the solution set.
Option D.
$(4, 0)$ is on the dashed line.
Because it is a dashed line (not a solid line because there is no equal sign), this is outside the solution set.
The axis of symmetry of the graph of p is x = –3
Function p has exactly one zero.
Based on this information, which graph could represent p?
A.
B.
C.
D.
Let us analyze each option.
Option A.
Zero: x = –3
Axis of Symmetry: x = –3
This is the correct answer.
Option B.
Zeros: x = –6 and x = 0
Axis of Symmetry: x = –3
Discard.
Option C.
Zero: x = 0 and x = 6
Axis of Symmetry: x = 3
Discard.
Option D.
Zero: x = 3
Axis of Symmetry: x = 3
Discard.
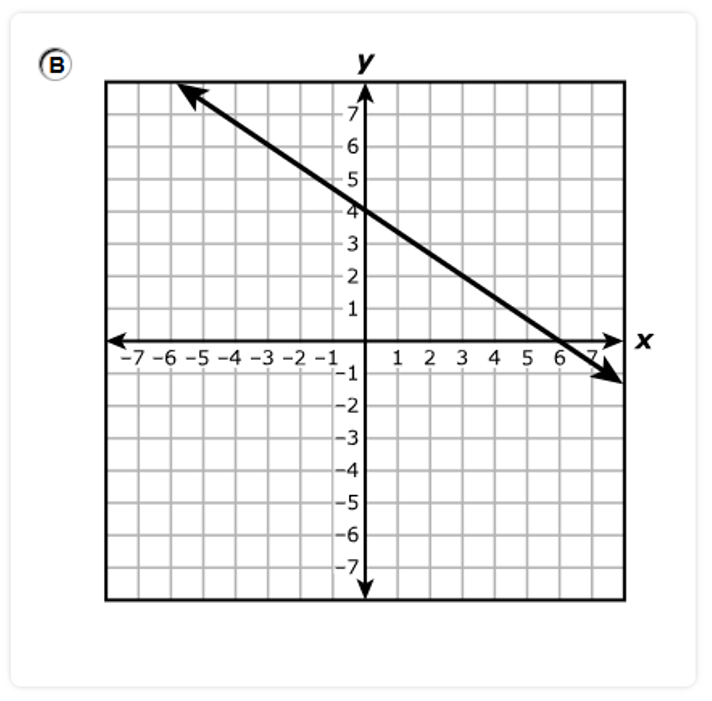
What are the slope and y-intercept of the graph of g?
A. The slope is $\dfrac{5}{7}$, and the y-intercept is –1.
B. The slope is $\dfrac{5}{7}$, and the y-intercept is 1.
C. The slope is $\dfrac{7}{5}$, and the y-intercept is –1.
D. The slope is $\dfrac{7}{5}$, and the y-intercept is 1.
$ m = \text{slope} \\[3ex] b = y-\text{intercept} = 1 \\[5ex] \text{Point 1: } (-7, -4) \\[3ex] x_1 = -7 \\[3ex] y_1 = -4 \\[5ex] \text{Point 2: } (7, 6) \\[3ex] x_2 = 7 \\[3ex] y_2 = 6 \\[5ex] m = \dfrac{y_2 - y_1}{x_2 - x_1} \\[5ex] m = \dfrac{6 - (-4)}{7 - (-7)} \\[5ex] m = \dfrac{10}{14} \\[5ex] m = \dfrac{5}{7} $
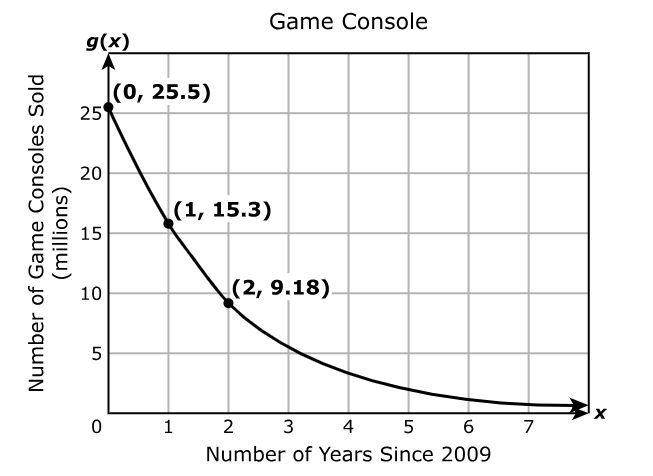
Based on this information, which function best models the number of game consoles sold in millions x years since 2009?
$ A.\;\; g(x) = 0.6(25.5)^x \\[4ex] B.\;\; g(x) = 25.5(0.6)^x \\[4ex] C.\;\; g(x) = 6.12(25.5)^x \\[4ex] D.\;\; g(x) = 25.5(6.12)^x \\[4ex] $
The correct answer is Option B.
Student: Just like that...
How do you know?
From the options?
Teacher: Yes, I know the answer from the options.
Recall: If the base of a basic exponential function is less than 1, then the exponential function is an
Student: Exponential Decay function
Yes, I see it now.
The other bases are greater than 1, hence they are Exponential Growth functions.
Teacher: That is correct.
Let us show our work anyway.
$ \underline{\text{Exponential Function}} \\[3ex] g(x) = ab^x \\[3ex] a = \text{initial value} \\[3ex] b = \text{base} \\[5ex] \text{Point 1: } (0, 25.5) \\[3ex] x = 0 \\[3ex] g(x) = 25.5 \\[3ex] 25.5 = a * b^{0} \\[3ex] 25.5 = a * 1 ...\text{Law 3 Exp} \\[3ex] a = 25.5 \\[5ex] \text{Point 2: } (2, 9.18) \\[3ex] x = 2 \\[3ex] g(x) = 9.18 \\[3ex] 9.18 = 25.5 * b^{2} \\[3ex] 25.5 * b^2 = 9.18 \\[3ex] b^2 = \dfrac{9.18}{25.5} \\[5ex] b^2 = 0.36 \\[3ex] b = \sqrt{0.36} \\[3ex] b = 0.6 \\[5ex] \implies \\[3ex] g(x) = 25.5(0.6)^x $
B.
C.
D.
$ \underline{\text{Inequality 1}} \\[3ex] \text{This is a dashed line because of the absence of the equality sign} \\[3ex] x + y \lt 1 \\[5ex] \text{When } x = 0 \\[3ex] 0 + y \lt 1 \\[3ex] y \lt 1 \\[5ex] \text{When } y = 0 \\[3ex] x + 0 \lt 1 \\[3ex] x \lt 1 \\[5ex] \underline{\text{Inequality 2}} \\[3ex] \text{This is a solid line because of the presence of the equality sign} \\[3ex] x - y \le 2 \\[5ex] \text{When } x = 0 \\[3ex] 0 - y \le 2 \\[3ex] -y \le 2 \\[3ex] y \ge \dfrac{2}{-1} \\[5ex] y \ge -2 \\[5ex] \text{When } y = 0 \\[3ex] x - 0 \le 2 \\[3ex] x \le 2 \\[3ex] $ To graph a system of inequalities, each inequality is shaded and the solution is where the shaded regions overlap.
The correct answer is Option A.
Record your answer in the boxes below.
$ p(x) = -4(x - 15)^2 + 2 \\[3ex] p(7) = -4(7 - 15)^2 + 2 \\[3ex] = -4(-8)^2 + 2 \\[3ex] = -4(64) + 2 \\[3ex] = -256 + 2 \\[3ex] = -254 $
Which function is best represented by this graph?
$ A.\;\; f(x) = -\dfrac{1}{2}x^2 + 16 \\[5ex] B.\;\; f(x) = -x^2 + 16 \\[4ex] C.\;\; f(x) = -\dfrac{1}{2}x^2 + 8 \\[5ex] D.\;\; f(x) = -x^2 + 8 \\[4ex] $
We can solve the question using at least two approaches.
Use any approach you prefer.
$ a = \text{leading coefficient} \\[5ex] \underline{\text{1st Approach: Equation of a Quadratic Function in Factored Form}} \\[3ex] f(x) = a(x - \alpha)(x - \beta) \\[3ex] \alpha, \beta = \text{zeros of the function} \\[3ex] \alpha = -4 \\[3ex] \beta = 4 \\[3ex] \implies \\[3ex] f(x) = a[x - (-4)](x - 4) \\[3ex] f(x) = a(x + 4)(x - 4) \\[3ex] f(x) = a(x^2 - 4^2)...\text{Difference of Two Squares} \\[4ex] f(x) = a(x^2 - 16) \\[5ex] \text{Passes through the point (vertex) } (0, 8) \\[3ex] x = 0 \\[3ex] f(x) = 8 \\[3ex] \implies \\[3ex] 8 = a(0^2 - 16) \\[3ex] 8 = a(0 - 16) \\[3ex] 8 = -16a \\[3ex] -16a = 8 \\[3ex] a = \dfrac{8}{-16} \\[5ex] a = -\dfrac{1}{2} \\[5ex] \implies \\[3ex] f(x) = -\dfrac{1}{2}(x^2 - 16) \\[5ex] f(x) = -\dfrac{1}{2}x^2 + 8 \\[5ex] \underline{\text{2nd Approach: Equation of a Quadratic Function in Vertex Form}} \\[3ex] f(x) = a(x - h)^2 + k ...\text{where } (h, k) \text{ is the vertex} \\[3ex] (h, k) = (0, 8) \\[3ex] h = 0 \\[3ex] k = 8 \\[3ex] \implies \\[3ex] f(x) = a(x - 0)^2 + 8 \\[3ex] f(x) = ax^2 + 8 \\[5ex] \text{Passes through the point: } (4, 0) \\[3ex] x = 4 \\[3ex] f(x) = 0 \\[3ex] \implies \\[3ex] 0 = a(4)^2 + 8 \\[3ex] 0 = 16a + 8 \\[3ex] 16a + 8 = 0 \\[3ex] 16a = -8 \\[3ex] a = \dfrac{-8}{16} \\[5ex] a = -\dfrac{1}{2} \\[5ex] \implies \\[3ex] f(x) = -\dfrac{1}{2}x^2 + 8 $
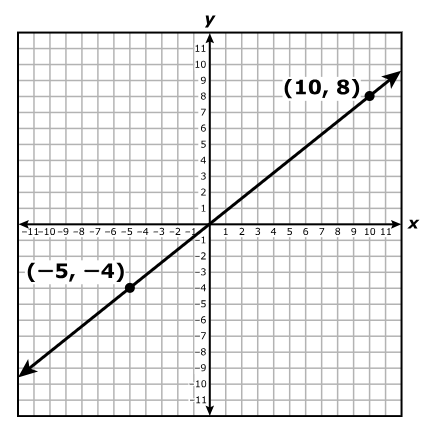
Given $f(x) = x$ and $h(x) = af(x)$, what is the value of a?
Record your answer in the boxes in the below.
$ \underline{\text{Linear Function}} \\[3ex] \text{slope} = m \\[3ex] \text{y-intercept} = b = 0 \\[5ex] \text{Point 1: } (-5, -4) \\[3ex] x_1 = -5 \\[3ex] y_1 = -4 \\[5ex] \text{Point 2: } (10, 8) \\[3ex] x_2 = 10 \\[3ex] y_2 = 8 \\[5ex] m = \dfrac{y_2 - y_1}{x_2 - x_1} \\[5ex] m = \dfrac{8 - (-4)}{10 - (-5)} \\[5ex] m = \dfrac{12}{15} \\[5ex] m = \dfrac{4}{5} \\[5ex] \text{Slope–Intercept Form} \\[3ex] h(x) = mx + b \\[3ex] h(x) = \dfrac{4}{5}x + 0 \\[5ex] h(x) = \dfrac{4}{5}x \\[5ex] f(x) = x \\[3ex] h(x) = af(x) \\[3ex] h(x) = a * f(x) \\[3ex] \implies \\[3ex] \dfrac{4}{5} * x = a * x \\[5ex] a = \dfrac{4}{5} \\[5ex] a = 0.8 $
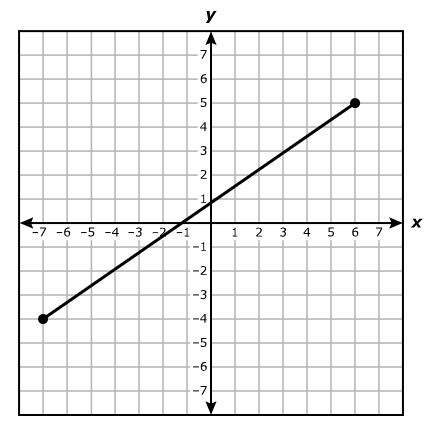
Which inequalities best describes the domain and range of the part shown?
$ A.\;\; \text{Domain: } -4 \lt x \lt 5 \\[3ex] \hspace{1.6em} \text{Range: } -7 \lt g(x) \lt 6 \\[5ex] B.\;\; \text{Domain: } -7 \lt x \lt 6 \\[3ex] \hspace{1.6em} \text{Range: } -4 \lt g(x) \lt 5 \\[5ex] C.\;\; \text{Domain: } -4 \le x \le 5 \\[3ex] \hspace{1.6em} \text{Range: } -7 \le g(x) \le 6 \\[5ex] D.\;\; \text{Domain: } -7 \le x \le 6 \\[3ex] \hspace{1.6em} \text{Range: } -4 \le g(x) \le 5 \\[3ex] $
The closed circle represents a closed interval.
The domain is the set of all the input values, x for which the function has an output.
On the graph, it is from –7 to 6
$\text{Domain: } -7 \le x \le 6$
The range of a function is the set of all output values that result from applying the function to its input values.
On the graph, it is from –4 to 5
$\text{Range: } -4 \le g(x) \le 5$
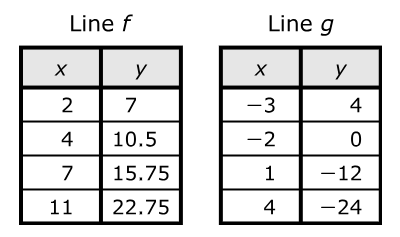
Which system of equations represents lines f and g?
$ A.\;\; y = 1.72x + 3.5 \\[3ex] \hspace{1.6em} y = -4x - 8 \\[5ex] B.\;\; y = 1.75x + 3.5 \\[3ex] \hspace{1.6em} y = -4x - 2 \\[5ex] C.\;\; y = 3.5x + 1.75 \\[3ex] \hspace{1.6em} y = -4x - 8 \\[5ex] D.\;\; y = 3.5x + 1.75 \\[3ex] \hspace{1.6em} y = -4x - 2 \\[3ex] $
$ \text{slope} = m \\[5ex] \underline{\text{Line 1}} \\[3ex] \text{Point 1: } (2, 7) \\[3ex] x_1 = 2 \\[3ex] y_1 = 7 \\[5ex] \text{Point 2: } (11, 22.75) \\[3ex] x_2 = 11 \\[3ex] y_2 = 22.75 \\[5ex] m = \dfrac{y_2 - y_1}{x_2 - x_1} \\[5ex] m = \dfrac{22.75 - 7}{11 - 2} \\[5ex] m = \dfrac{15.75}{9} \\[5ex] m = 1.75 \\[5ex] \text{Point–Slope Form} \\[3ex] y - y_1 = m(x - x_1) \\[3ex] y - 7 = 1.75(x - 2) \\[5ex] \text{Slope–Intercept Form} \\[3ex] y = 1.75x - 3.5 + 7 \\[3ex] y = 1.75x + 3.5 \\[5ex] \underline{\text{Line 2}} \\[3ex] \text{Point 1: } (-3, 4) \\[3ex] x_1 = -3 \\[3ex] y_1 = 4 \\[5ex] \text{Point 2: } (4, -24) \\[3ex] x_2 = 4 \\[3ex] y_2 = -24 \\[5ex] m = \dfrac{y_2 - y_1}{x_2 - x_1} \\[5ex] m = \dfrac{-24 - 4}{4 - (-3)} \\[5ex] m = \dfrac{-28}{7} \\[5ex] m = -4 \\[5ex] \text{Point–Slope Form} \\[3ex] y - y_1 = m(x - x_1) \\[3ex] y - 4 = -4[x - (-3)] \\[3ex] y - 4 = -4(x + 3) \\[5ex] \text{Slope–Intercept Form} \\[3ex] y = -4x - 12 + 4 \\[3ex] y = -4x - 8 \\[5ex] \therefore \text{The system of equations shown on the graph is:} \\[3ex] y = 1.75x + 3.5 \\[3ex] y = -4x - 8 $
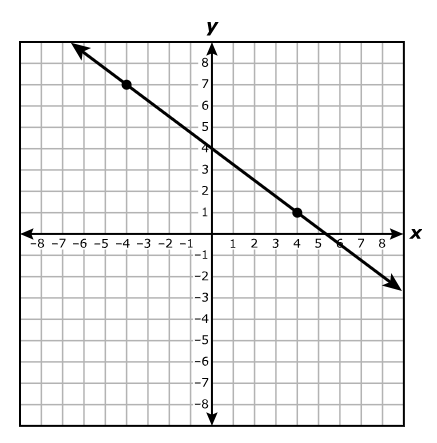
What is the rate of change of y with respect to x for this function?
$ A.\;\; \dfrac{7}{9} \\[5ex] B.\;\; -\dfrac{7}{9} \\[5ex] C.\;\; \dfrac{3}{4} \\[5ex] D.\;\; -\dfrac{3}{4} \\[5ex] $
The rate of change of y with respect to x for this function is the slope of the function.
$ \text{Point 1: } (-4, 7) \\[3ex] x_1 = -4 \\[3ex] y_1 = 7 \\[5ex] \text{Point 2: } (4, 1) \\[3ex] x_2 = 4 \\[3ex] y_2 = 1 \\[5ex] \text{slope, } m = \dfrac{y_2 - y_1}{x_2 - x_1} \\[5ex] m = \dfrac{1 - 7}{4 - (-4)} \\[5ex] m = \dfrac{-6}{8} \\[5ex] m = -\dfrac{3}{4} $
Record your answer in the boxes below.
$ g(x) = 73\left(\dfrac{4}{5}\right)^x \\[5ex] \text{When } x = 0 \\[3ex] y-\text{intercept} = g(0) = 73 \cdot \left(\dfrac{4}{5}\right)^0 \\[5ex] g(0) = 73 \cdot 1 ...\text{Law 3 Exp} \\[3ex] g(0) = 73 $
Which graph could represent g?
A.
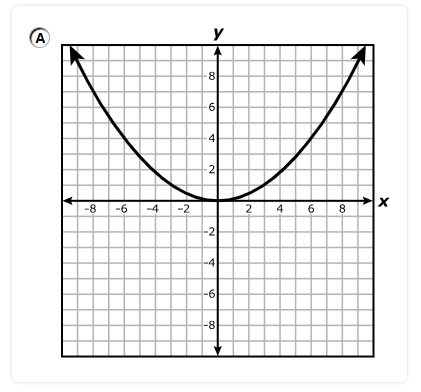
B.
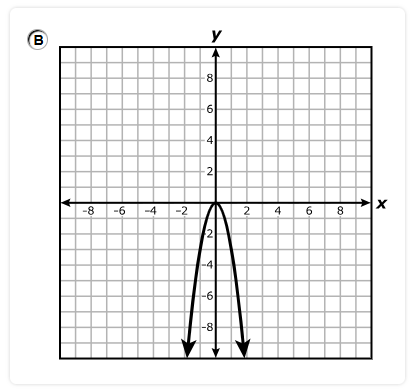
C.
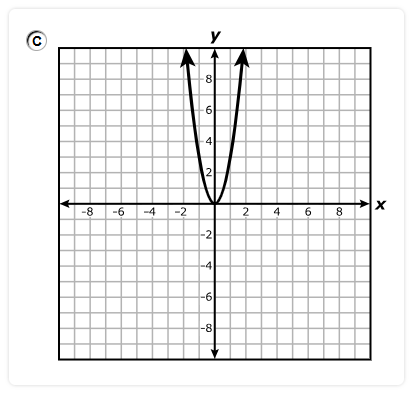
D.
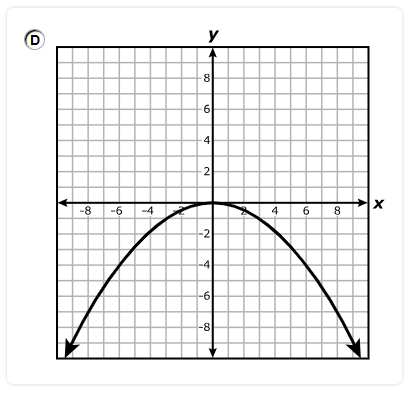
Parent Function
$ f(x) = x^2 \\[3ex] (2, 4) $
1st Transformation: Reflection across the x-axis
Also known as Vertical Reflection
This will flip the graph vertically.
$(2, 4) \rightarrow (2, -4)$
2nd Transformation: Horizontal Stretch will stretch the graph horizontally, making it wider.
This implies that the correct answer is Option D.
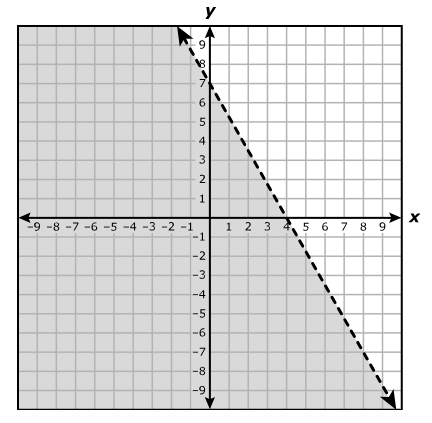
$ A.\;\; 4x + 7y \le 49 \\[3ex] B.\;\; 4x + 7y \lt 49 \\[3ex] C.\;\; 7x + 4y \le 28 \\[3ex] D.\;\; 7x + 4y \lt 28 \\[3ex] $
Because of the dashed line, the inequality will not contain an equality sign.
$ \text{When } x = 0, y = 7 \implies 7x \\[3ex] \text{When } y = 0, x = 4 \implies 4y \\[3ex] xy = 7(4) = 28 \\[3ex] \text{shaded region is below the line} \implies \lt \\[3ex] \implies \\[3ex] 7x + 4y \lt 28 $
A.
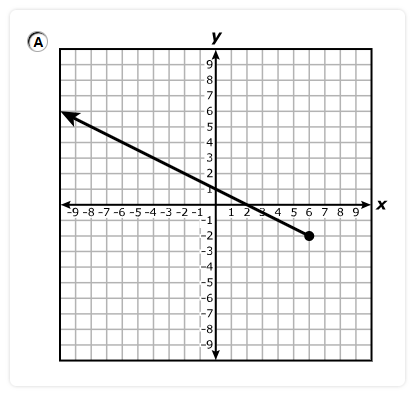
B.
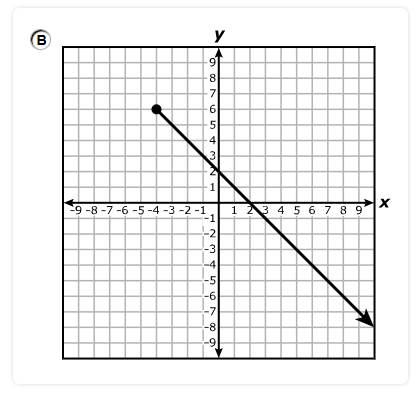
C.
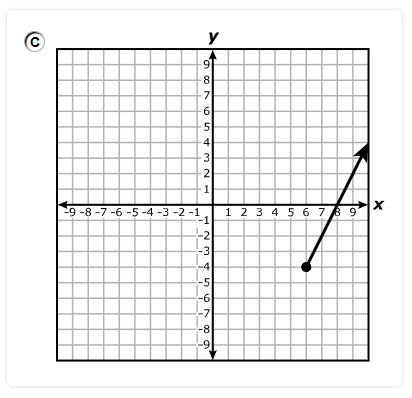
D.
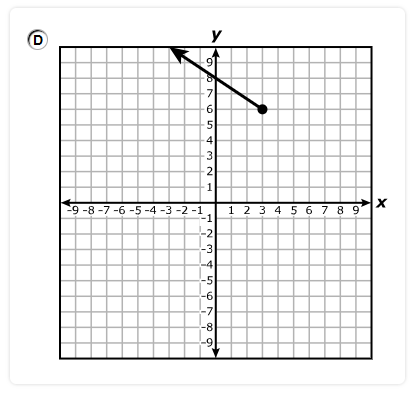
The domain is the set of all the input values, x for which the function has an output.
The closed circle represents a closed interval. It indicates that the endpoint is included.
The arrow represents infinity (positive or negative infinity as applicable).
Let us analyze each option and discard the incorrect ones.
Option A.
The domain is the set of all real numbers less than or equal to 6
This is the correct option.
Option B.
The domain is the set of all real numbers greater than or equal to –3.
Discard.
Option C.
The domain is the set of all real numbers greater than or equal to 6
Discard.
Option D.
The domain is the set of all real numbers less than or equal to 3
Discard.
The graph of the function is shown.
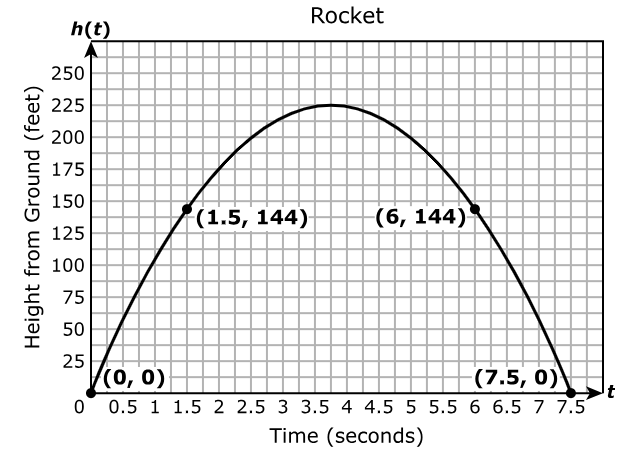
What is the maximum value of the graph of the function?
Record your answer in the boxes below.
The maximum value of the graph of the function is +225 feet.
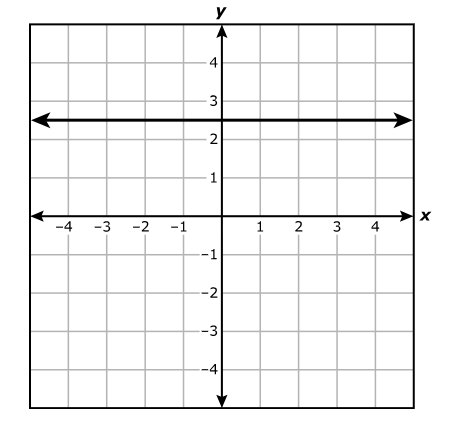
A. The equation of the line is x = 2.5, and the line is parallel to the x-axis.
B. The equation of the line is x = 2.5, and the line is perpendicular to the x-axis.
C. The equation of the line is y = 2.5, and the line is parallel to the x-axis.
D. The equation of the line is y = 2.5, and the line is perpendicular to the x-axis.
C. The equation of the line is y = 2.5, and the line is parallel to the x-axis.
Which graph best represents t?
A.
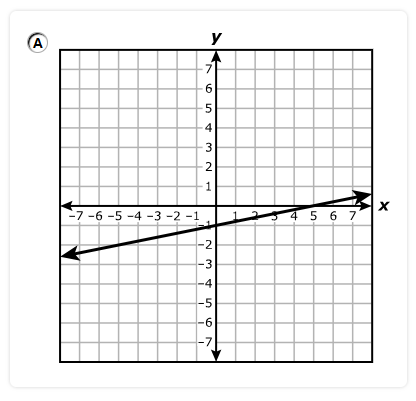
B.
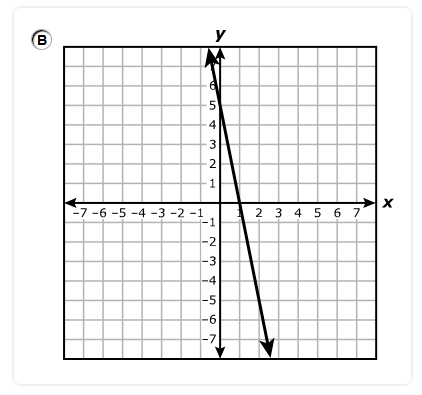
C.
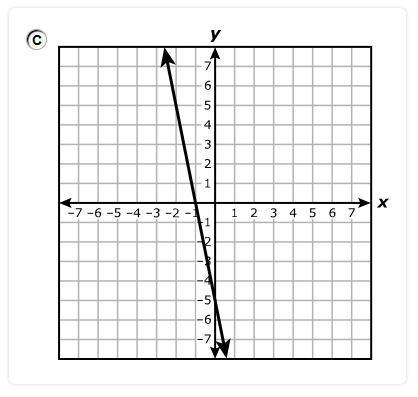
D.
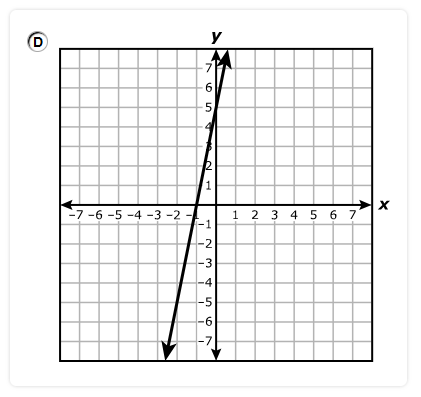
The x-intercept is the point where the graph intersects the x-axis.
The y-intercept is the point where the graph intersects the y-axis.
Let us analyze the options and discard the incorrect ones.
Option A.
x-intercept: (5, 0)
y-intercept: (0, –1)
Discard.
Option B.
x-intercept: (1, 0)
y-intercept: (0, 5)
Discard.
Option A.
x-intercept: (–1, 0)
y-intercept: (0, –5)
Discard.
Option A.
x-intercept: (–1, 0)
y-intercept: (0, 5)
This is the correct answer.
When x = 3.5, the value of y is 14.
What is the value of y when x = 28?
Record your answer in the boxes below.
$ y \propto x \\[3ex] y = kx ...k\text{ is the constant of variation} \\[3ex] \text{When } x = 3.5, y = 14 \\[3ex] k = ? \\[3ex] 14 = k * 3.5 \\[3ex] 3.5k = 14 \\[3ex] k = \dfrac{14}{3.5} \\[5ex] k = 4 \\[5ex] \implies \\[3ex] y = 4x \\[5ex] \text{When } x = 28, y = ? \\[3ex] y = 4(28) \\[3ex] y = 112 $
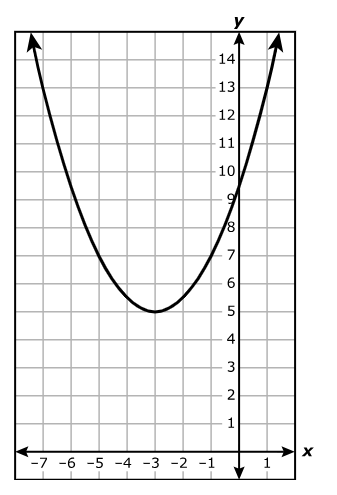
Which answer choice best represents the domain and range of the function?
A. Domain: x ≥ –3
Range: y ≥ 5
B. Domain: All real numbers
Range: y ≥ 5
C. Domain: x ≥ –3
Range: All real numbers
D. Domain: y ≥ 5
Range: x ≥ –3
The domain is the set of all the input values, x for which the function has an output.
The arrow represents infinity (positive or negative infinity as applicable).
On the graph, the domain has arrows on both the LHS (Left Hand Side) and the RHS (Right Hand Side).
This means that the domain includes both positive infinity and negative infinity.
Therefore, the domain is all real numbers.
The range of a function is the set of all output values that result from applying the function to its input values.
On the graph, it begins from 5 up to positive infinity
This implies that the range is all real numbers greater than or equal to 5.
B. Domain: All real numbers
Range: y ≥ 5
A.
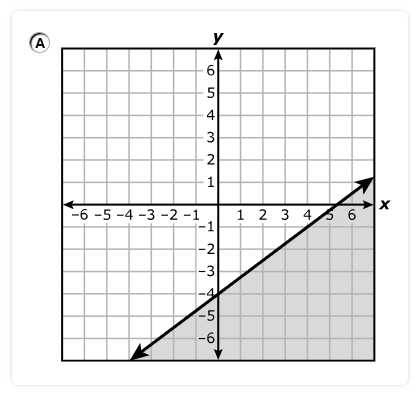
B.
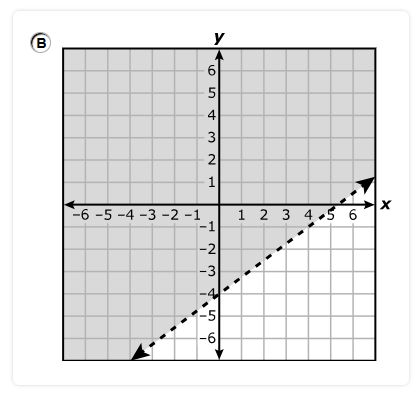
C.
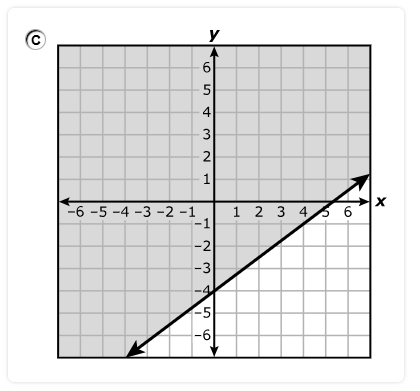
D.
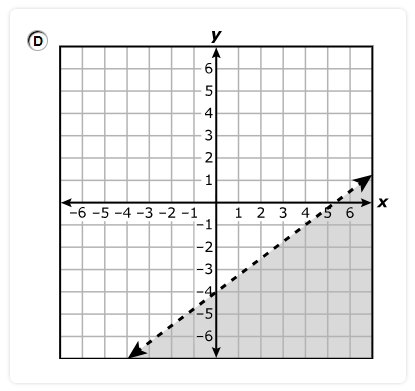
Because the inequality contains an equal sign, the line is a solid line.
$ y \le \dfrac{3}{4}x - 4 \\[5ex] \text{When } x = 0 \\[3ex] y \le \dfrac{3}{4} * 0 - 4 \\[5ex] y \le 0 - 4 \\[3ex] y \le -4 \\[5ex] \text{When } x = 4 \\[3ex] y \le \dfrac{3}{4} * 4 - 4 \\[5ex] y \le 3 - 4 \\[3ex] y \le -1 \\[3ex] $ Less than or equal to implies that the shaded region is below the solid line.
Option A. is the correct answer.
The data can be modeled by a quadratic function.
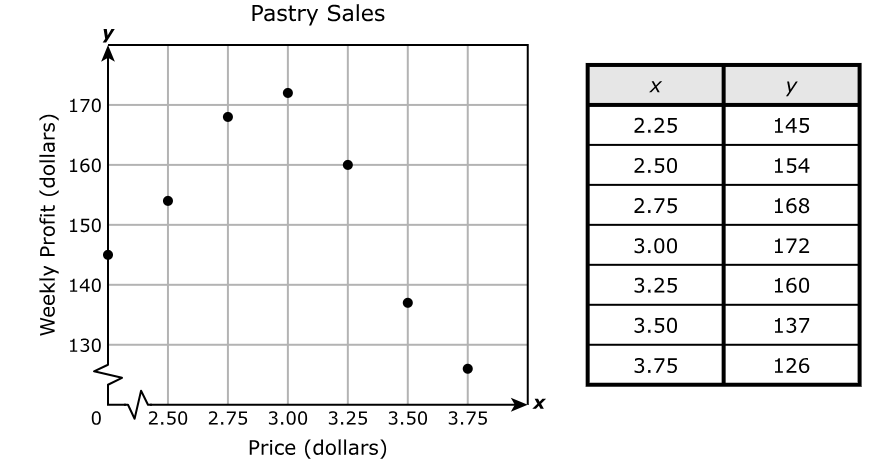
Which function best models the data?
$ A.\;\; y = 0.001x^2 - 0.426x + 35.672 \\[3ex] B.\;\; y = -60.4x^2 + 348.1x - 334.2 \\[3ex] C.\;\; y = 0.001x^2 + 35.672 \\[3ex] D.\;\; y = -60.4x^2 - 334.2 \\[3ex] $
There are at least two approaches to solve the question.
We can find the answer by analyzing the options.
We can also write a 3 by 3 linear system using the information given to us.
I recommend that we analyze the options to get the answer, rather than solving a 3 by 3 linear system to get the function.
Analyzing the options: let us test the first option.
$ \text{Point 1: } (2.25, 145) \\[3ex] x = 2.25 \\[3ex] y = 145 \\[5ex] \text{Option A.} \\[3ex] y = 0.001(2.25)^2 - 0.426(2.25) + 35.672 \\[3ex] y = 34.7185625 \ne 145 \\[3ex] \text{Discard} \\[5ex] \text{Option B.} \\[3ex] y = -60.4(2.25)^2 + 348.1(2.25) - 334.2 \\[3ex] y = 143.25 \\[3ex] \text{Do not discard because 143.25 is close to 145} \\[5ex] \text{Option C.} \\[3ex] y = 0.001(2.25)^2 + 35.672 \\[3ex] y = 35.6770625 \ne 145 \\[3ex] \text{Discard} \\[5ex] \text{Option D.} \\[3ex] y = -60.4(2.25)^2 - 334.2 \\[3ex] y = -639.975 \ne 145 \\[3ex] \text{Discard} \\[5ex] \text{Just to confirm, test another value for Option B.} \\[3ex] \text{Point 2: } (3.75, 126) \\[3ex] x = 3.75 \\[3ex] y = 126 \\[5ex] \text{Option B.} \\[3ex] y = -60.4(3.75)^2 + 348.1(3.75) - 334.2 \\[3ex] y = 121.8 \\[3ex] \text{121.8 is close to 126} \\[3ex] \text{This is the correct answer.} $
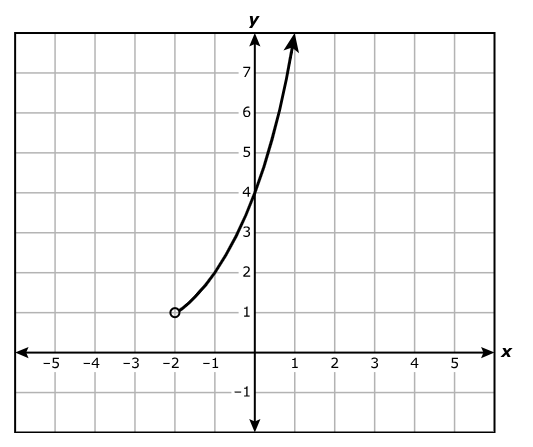
Which inequality best represents the domain of the part shown?
$ A.\;\; x \gt 1 \\[3ex] B.\;\; y \gt 1 \\[3ex] C.\;\; x \gt -2 \\[3ex] D.\;\; y \gt -2 \\[3ex] $
The open circle represents an open interval.
The arrow represents infinity.
The domain is the set of all the input values, x for which the function has an output.
On the graph, it is from –2 (not included) to positive infinity
Domain:
–2 < x < ∞
Also written as: x > –2
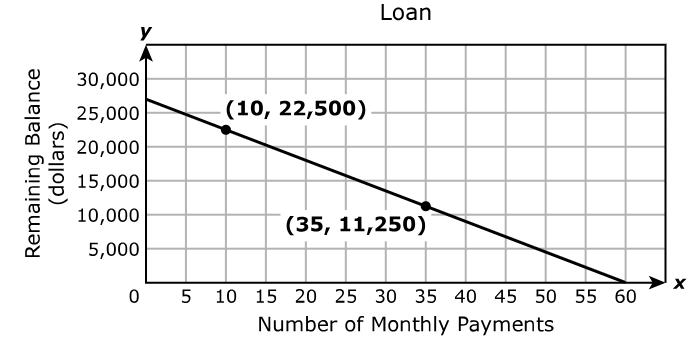
Which statement describes the x-intercept of the graph?
A. The x-intercept is 60, which represents the initial balance in dollars of the loan.
B. The x-intercept is 27,000, which represents the initial balance in dollars of the loan.
C. The x-intercept is 60, which represents the number of monthly payments needed to repay the loan.
D. The x-intercept is 27,000, which represents the number of monthly payments needed to repay the loan.
The correct answer is Option C.
The x-intercept is 60, which represents the number of monthly payments needed to repay the loan.
A.
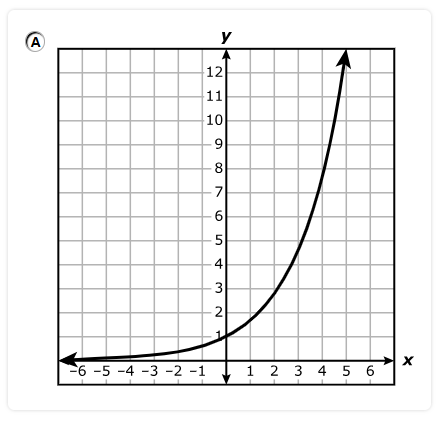
B.
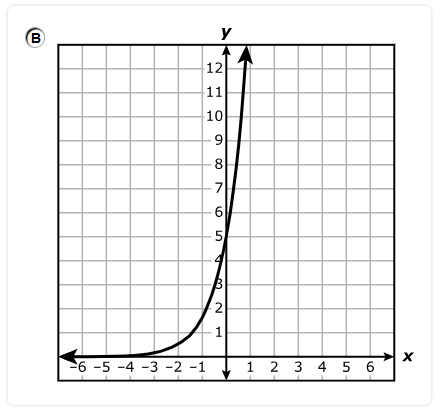
C.
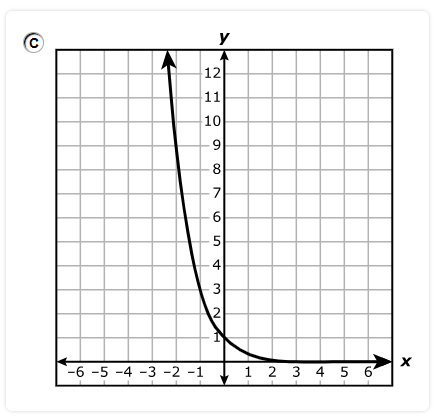
D.
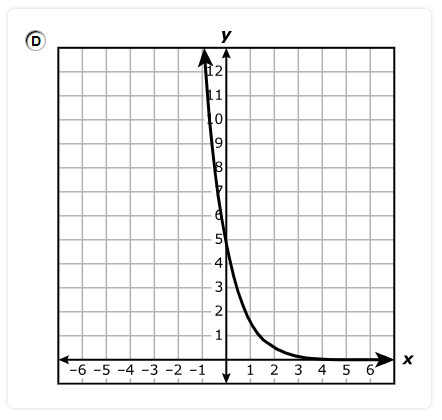
Exponential growth produces a rising curve, whereas exponential decay produces a falling curve.
$ \underline{\text{Exponential Function}} \\[3ex] y = 5\left(\dfrac{1}{3}\right)^x \\[5ex] \dfrac{1}{3} \lt 1 ...\text{This means that the function is an exponential decay function} \\[5ex] \text{When } x = 0 \\[3ex] y = 5\left(\dfrac{1}{3}\right)^0 \\[5ex] y = 5 \cdot 1 ...\text{Law 3 Exp} \\[3ex] y = 5 ...\text{initial value} \\[3ex] $ This implies that the correct answer is Option D.
The graph shows the height in yards of the golf ball above the ground as a quadratic function of x, the horizontal distance in yards of the golf ball from the tee box.
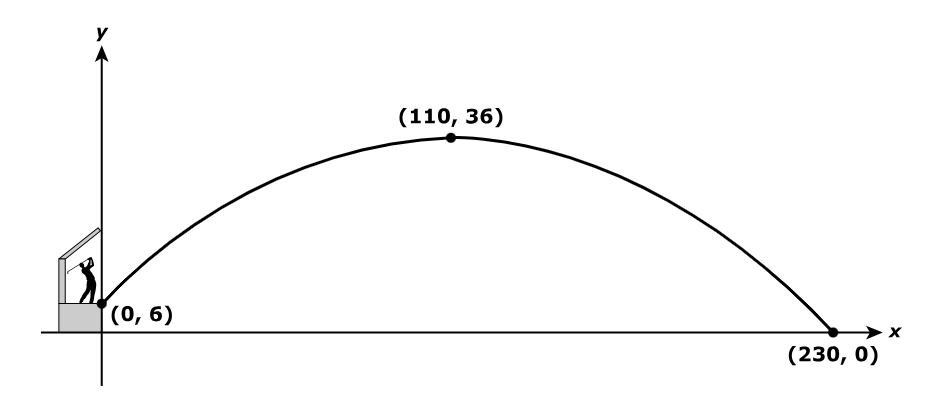
What is the domain of the function for this situation?
$ A.\;\; 0 \le x \le 230 \\[3ex] B.\;\; 6 \le y \le 36 \\[3ex] C.\;\; 0 \le y \le 36 \\[3ex] D.\;\; 6 \le x \le 230 \\[3ex] $
The domain is the set of all the input values, x for which the function has an output.
The domain is $0 \le x \le 230$
A.
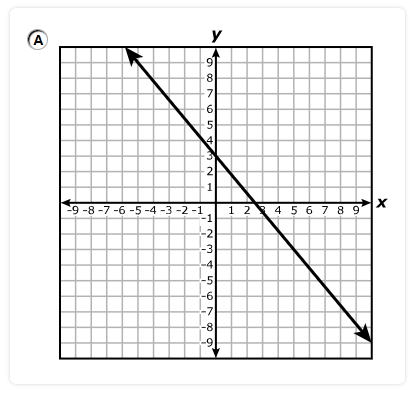
B.
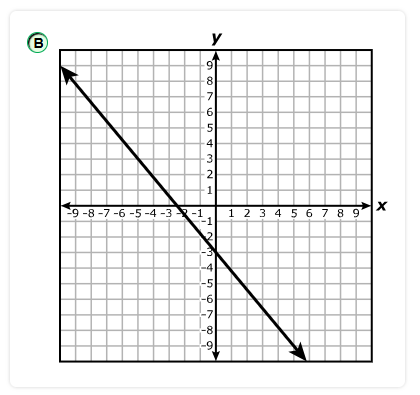
C.
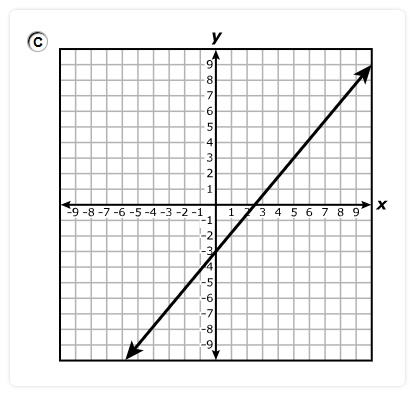
D.
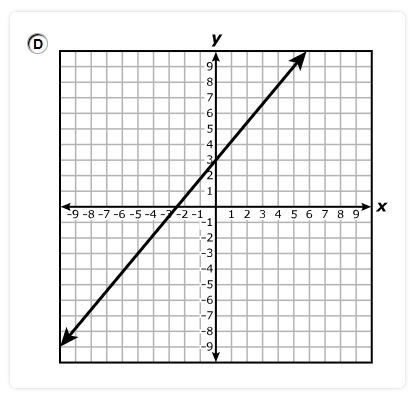
$ -5y = -6x + 15 \\[5ex] \text{When } y = 0 \\[3ex] -5(0) = -6x + 15 \\[3ex] 0 + 6x = 15 \\[3ex] 6x = 15 \\[3ex] x = \dfrac{15}{6} \\[5ex] x = 2.5 \\[3ex] x-\text{intercept} = (2.5, 0) \\[5ex] \text{When } x = 0 \\[3ex] -5y = -6(0) + 15 \\[3ex] -5y = 0 + 15 \\[3ex] -5y = 15 \\[3ex] y = \dfrac{15}{-5} \\[5ex] y = -3 \\[3ex] y-\text{intercept} = (0, -3) \\[3ex] $ The correct answer is Option C.
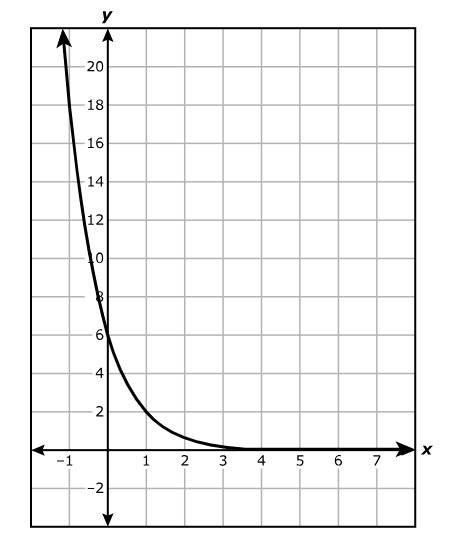
Which function is best represented by the graph?
$ A.\;\; g(x) = 6\left(\dfrac{1}{3}\right)^x \\[5ex] B.\;\; g(x) = 6(3)^x \\[4ex] C.\;\; g(x) = 6 - \left(\dfrac{1}{3}\right)^x \\[5ex] D.\;\; g(x) = 6 - (3)^x \\[4ex] $
$ \underline{\text{Exponential Function}} \\[3ex] y = ab^x \\[3ex] y-\text{intercept} = a = \text{initial value} = 6 \\[3ex] b = \text{base} \\[5ex] \text{Point: } (1, 2) \\[3ex] x = 1 \\[3ex] y = 2 \\[3ex] 2 = 6 * b^{1} \\[3ex] 6b = 2 \\[3ex] b = \dfrac{2}{6} \\[5ex] b = \dfrac{1}{3} \\[5ex] \implies \\[3ex] y = 6\left(\dfrac{1}{3}\right)^x $
The graph shows the remaining percentage of the workout as a linear function of x, the time in minutes.
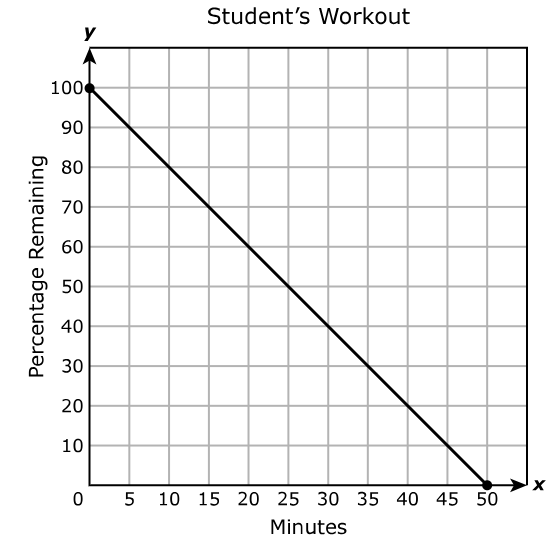
Which answer choice best describes the domain and range of the function for this situation?
A. Domain: All real numbers greater than or equal to 0 and less than or equal to 100
Range: All real numbers greater than or equal to 0 and less than or equal to 50
B. Domain: {–2}
Range: {100}
C. Domain: All real numbers greater than or equal to 0 and less than or equal to 50
Range: All real numbers greater than or equal to 0 and less than or equal to 100
D. Domain: {100}
Range: {–2}
The domain is the set of all the input values, x for which the function has an output.
The closed circle represents a closed interval. It shows that the end point is included.
Based on the graph:
The domain is from 0 through 50. (The end points, 0 and 50 are included).
The range is from 0 through 100. (The end points, 0 and 100 are included).
C. Domain: All real numbers greater than or equal to 0 and less than or equal to 50
Range: All real numbers greater than or equal to 0 and less than or equal to 100
Which graph best represents g?
A.
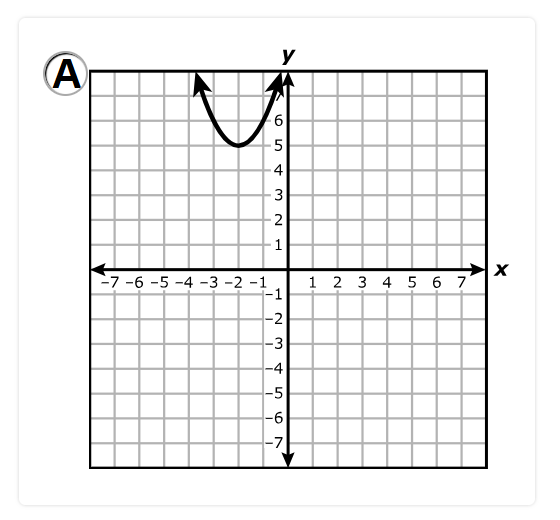
B.
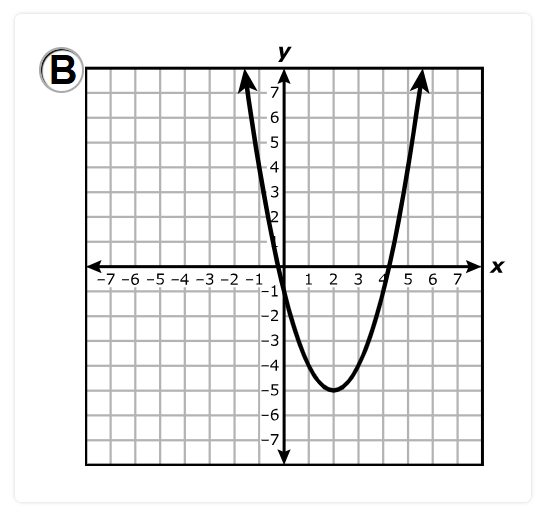
C.
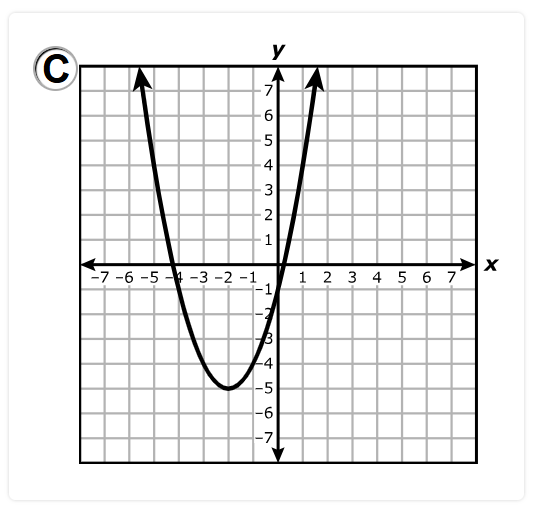
D.
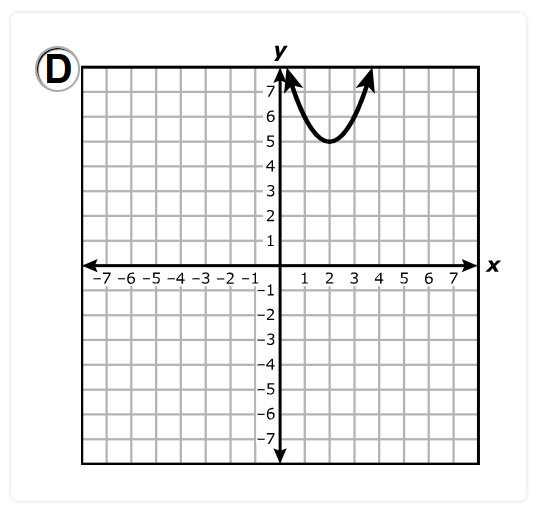
Function Family: Quadratic Function
Parent Function: $f(x)$
$f(x) = x^2$
Vertex = (0, 0)
Transformed Function: $g(x)$
$g(x) = f(x + 2) - 5$
1st Transformation: Horizontal Shift 2 units left.
(0, 0) → (0 – 2, 0)
→ (–2, 0)
2nd Transformation: Vertical Shift 5 units down.
(–2, 0) → (–2, 0 – 5)
→ (–2, –5)
Vertex = (–2, –5)
The correct answer is Option C.
$ 4x^2 + 12x = 135 \\[3ex] 4x^2 + 12x - 135 = 0 \\[3ex] 4x^2 * -135 = -540x^2 \\[3ex] \text{Factors are: } 30x \text{ and } -18x \\[3ex] 4x^2 + 30x - 18x - 135 = 0 \\[3ex] 2x(2x + 15) - 9(2x + 15) = 0 \\[3ex] (2x + 15)(2x - 9) = 0 \\[3ex] \underline{\text{Zero Product Property}} \\[3ex] 2x + 15 = 0 \text{ or } 2x - 9 = 0 \\[3ex] 2x = -15 \text{ or } 2x = 9 \\[3ex] x = -\dfrac{15}{2} \text{ or } x = \dfrac{9}{2} \\[5ex] x = -7.5 \text{ or } x = 4.5 $
A.

B.
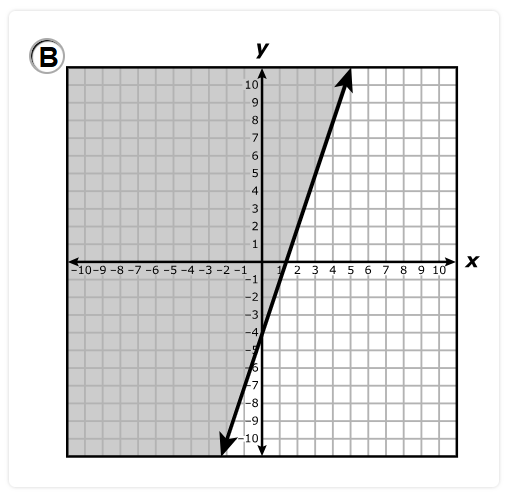
C.
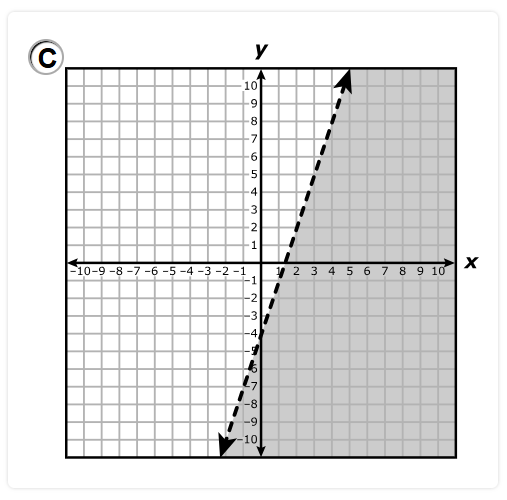
D.
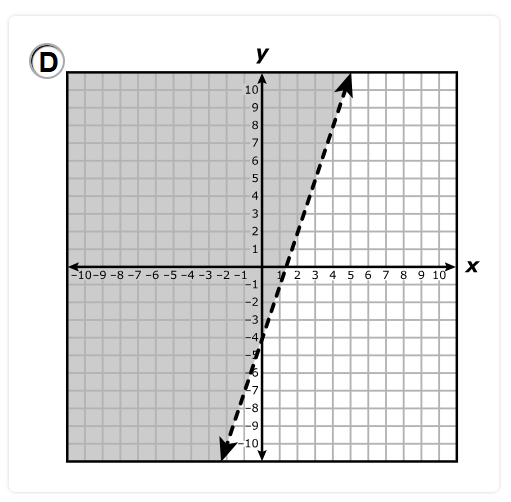
Because the inequality does not contain an equal sign, the line will be a dashed line.
$ y \gt 3x - 4 \\[5ex] \text{When } x = 0 \\[3ex] y \gt 3(0) - 4 \\[3ex] y \gt 0 - 4 \\[3ex] y \gt -4 ...\text{Mark point } (0, -4) \\[3ex] \text{The shaded area is upwards from } y = -4 \\[5ex] \text{When } y = 0 \\[3ex] 0 \gt 3x - 4 \\[3ex] 3x - 4 \lt 0 \\[3ex] 3x \lt 0 + 4 \\[3ex] 3x \lt 4 \\[3ex] x \lt \dfrac{4}{3} \\[5ex] x \lt 1.3\bar{3} ...\text{Mark point } (1.3\bar{3}, 0) \\[3ex] \text{The shaded area is to the left of } x = 1.3\bar{3} \\[3ex] $ Draw a straight dashed line connecting the two points: $(0, -4)$ and $(1.3\bar{3}, 0)$
Shade the regions accordingly.
Locate the overlap of the two regions.
The correct answer is Option D.
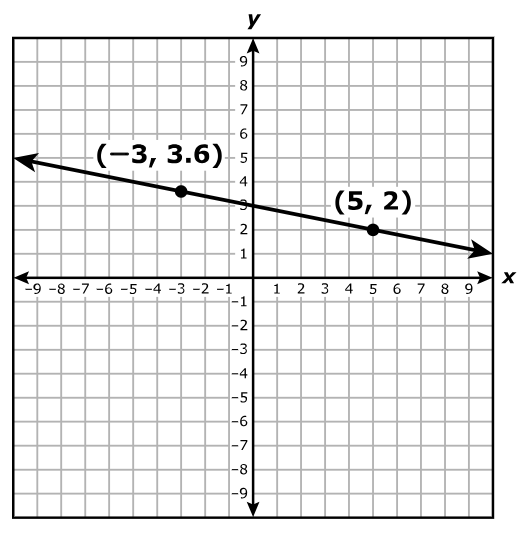
What is the rate of change of y with respect to x for this function?
Record your answer in the boxes below.
The rate of change of y with respect to x for the function is the slope of the function. $ \text{Point 1: } (-3, 3.6) \\[3ex] x_1 = -3 \\[3ex] y_1 = 3.6 \\[5ex] \text{Point 2: } (5, 2) \\[3ex] x_2 = 5 \\[3ex] y_2 = 2 \\[5ex] \text{slope, } m = \dfrac{y_2 - y_1}{x_2 - x_1} \\[5ex] m = \dfrac{2 - 3.6}{5 - (-3)} \\[5ex] m = \dfrac{-1.6}{8} \\[5ex] m = -0.2 $
A.
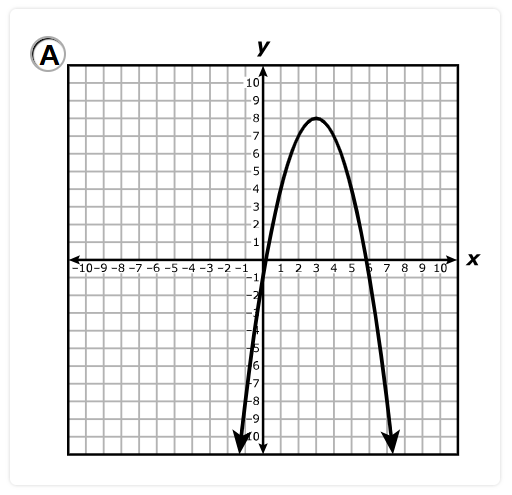
B.
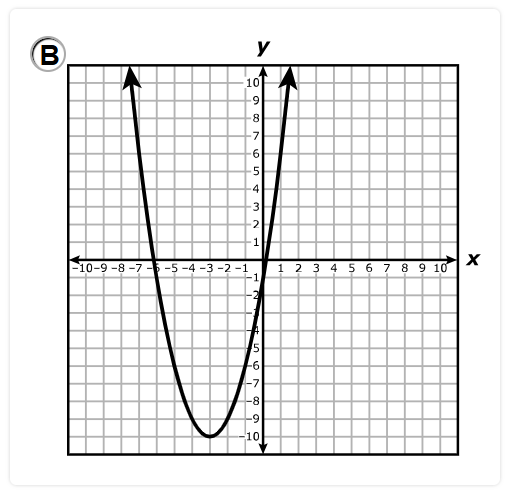
C.
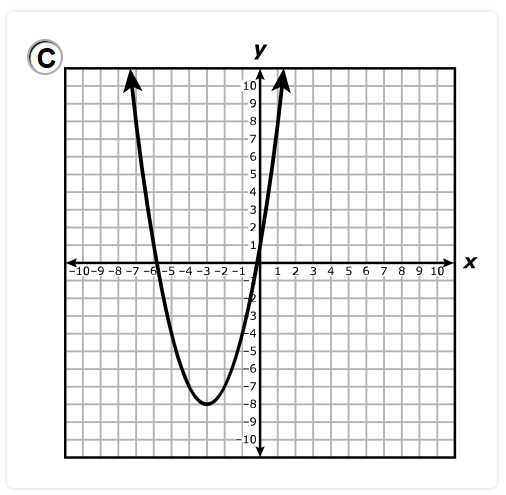
D.
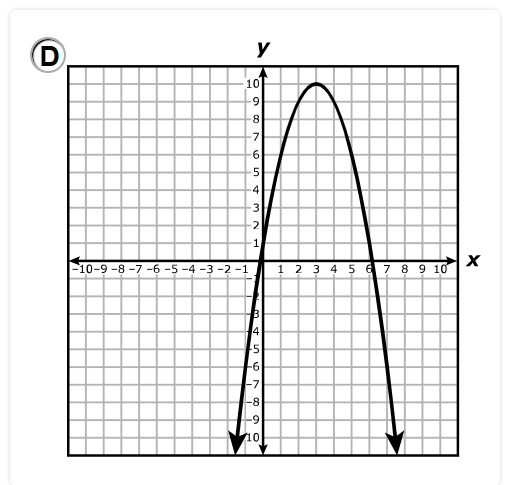
$ y = -x^2 + 6x - 1 \\[3ex] \text{Compare to the standard form of a quadratic function: } y = ax^2 + bx + c \\[3ex] a = -1 \\[3ex] b = 6 \\[3ex] c = -1 \\[3ex] $ 1st: Leading Coefficient
Leading Coefficient, a = –1
–1 < 0
The parabola (graph of a quadratic function) is concave down because the leading coefficient is negative.
2nd: Vertex
$ x-\text{coordinate of Vertex} = -\dfrac{b}{2a} \\[5ex] = -\dfrac{6}{2(-1)} \\[5ex] = \dfrac{-6}{-2} \\[5ex] = 3 \\[5ex] x-\text{coordinate of Vertex} = f(3) \\[3ex] = -1(3)^2 + 6(3) + (-1) \\[3ex] = -9 + 18 - 1 \\[3ex] = 8 \\[5ex] \text{Vertex} = (3, 8) \\[3ex] $ Option A. is the correct answer.
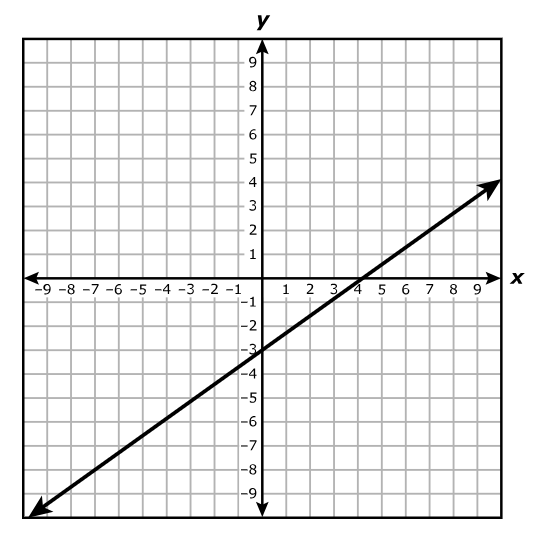
Which equation is best represented by this graph?
$ A.\;\; y + 2 = \dfrac{7}{5}(x + 7) \\[5ex] B.\;\; y - 2 = \dfrac{7}{5}(x - 7) \\[5ex] C.\;\; y + 2 = \dfrac{5}{7}(x + 7) \\[5ex] D.\;\; y - 2 = \dfrac{5}{7}(x - 7) \\[5ex] $
$ m = \text{slope} \\[3ex] b = y-\text{intercept} = -3 \\[5ex] \text{Point 1: } (0, -3) \\[3ex] x_1 = 0 \\[3ex] y_1 = -3 \\[5ex] \text{Point 2: } (4, 0) \\[3ex] x_2 = 4 \\[3ex] y_2 = 0 \\[5ex] m = \dfrac{y_2 - y_1}{x_2 - x_1} \\[5ex] m = \dfrac{0 - (-3)}{4 - 0} \\[5ex] m = \dfrac{3}{4} \\[5ex] \text{Slope–Intercept Form} \\[3ex] y = mx + b \\[3ex] y = \dfrac{3}{4}x - 3 \\[5ex] $ Our answer is not listed as an option.
So, let us find the answer option that best resembles our answer.
The slope is $\dfrac{3}{4} = 0.75$.
The slope should be less than 1.
Discard Options A. and B because the slope in those functions is $\dfrac{7}{5}$
Besides $\dfrac{5}{7}$ is closer to $\dfrac{3}{4}$ rather than $\dfrac{7}{5}$.
Let us simplify Options C. and D. so we can find the y-intercept for each function.
$ \text{Option C.} \\[3ex] y + 2 = \dfrac{5}{7}(x + 7) \\[5ex] y + 2 = \dfrac{5}{7}x + 5 \\[5ex] y = \dfrac{5}{7}x + 5 - 2 \\[5ex] y = \dfrac{5}{7}x + 3 \\[5ex] b = 3 \\[3ex] $ Discard Option C. because the y-intercept is 3, rather than –3.
$ \text{Option D.} \\[3ex] y - 2 = \dfrac{5}{7}(x - 7) \\[5ex] y - 2 = \dfrac{5}{7}x - 5 \\[5ex] y = \dfrac{5}{7}x - 5 + 2 \\[5ex] y = \dfrac{5}{7}x - 3 \\[5ex] b = -3 \\[3ex] $ Option D. is the correct answer.
What is the zero of f?
$ A.\;\; 2 \\[3ex] B.\;\; 4 \\[3ex] C.\;\; -6 \\[3ex] D.\;\; -2 \\[3ex] $
$ m = \text{slope} = -3 \\[5ex] \text{Passes through Point } (1, -9) \\[3ex] x_1 = 1 \\[3ex] y_1 = -9 \\[5ex] \text{Point–Slope Form} \\[3ex] y - y_1 = m(x - x_1) \\[3ex] y - (-9) = -3(x - 1) \\[3ex] y + 9 = -3x + 3 \\[3ex] y = -3x + 3 - 9 \\[3ex] y = -3x - 6 \\[3ex] -3x - 6 = y \\[5ex] \text{Zero of } f \\[3ex] \text{When } y = 0 \\[3ex] -3x - 6 = 0 \\[3ex] -3x = 0 + 6 \\[3ex] -3x = 6 \\[3ex] x = \dfrac{6}{-3} \\[5ex] x = -2 $
Record your answer in the boxes below.
$ h(x) = 29(5.2)^x \\[3ex] y-\text{intercept} = h(0) \\[3ex] h(0) = 29(5.2)^0 \\[3ex] h(0) = 29(1)...\text{Law 3 Exp} \\[3ex] h(0) = 29 $
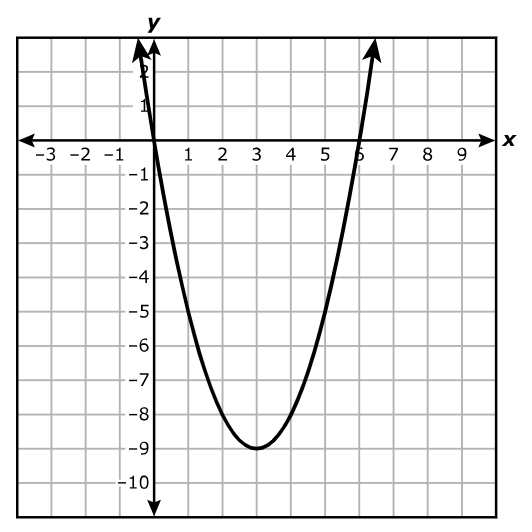
Which function is best represented by this graph?
$ A.\;\; h(x) = x^2 - 3x - 9 \\[3ex] B.\;\; h(x) = x^2 + 3x - 9 \\[3ex] C.\;\; h(x) = x^2 - 6x \\[3ex] D.\;\; h(x) = x^2 + 6x \\[3ex] $
We can solve the question using at least two approaches.
Use any approach you prefer.
$ a = \text{leading coefficient} \\[5ex] \underline{\text{1st Approach: Equation of a Quadratic Function in Factored Form}} \\[3ex] f(x) = a(x - \alpha)(x - \beta) \\[3ex] \alpha, \beta = \text{zeros of the function} \\[3ex] \alpha = 0 \\[3ex] \beta = 6 \\[5ex] \implies \\[3ex] h(x) = a(x - 0)(x - 6) \\[3ex] h(x) = ax(x - 6) \\[5ex] \text{Passes through the point (vertex) } (3, -9) \\[3ex] x = 3 \\[3ex] h(x) = -9 \\[3ex] \implies \\[3ex] -9 = a(3)(3 - 6) \\[3ex] -9 = a(3)(-3) \\[3ex] -9 = -9a \\[3ex] -9a = -9 \\[3ex] a = \dfrac{-9}{-9} = 1 \\[5ex] \implies \\[3ex] h(x) = 1 * x(x - 6) \\[3ex] h(x) = x(x - 6) \\[3ex] h(x) = x^2 - 6x \\[5ex] \underline{\text{2nd Approach: Equation of a Quadratic Function in Vertex Form}} \\[3ex] h(x) = a(x - h)^2 + k ...\text{where } (h, k) \text{ is the vertex} \\[3ex] (h, k) = (3, -9) \\[3ex] h = 3 \\[3ex] k = -9 \\[3ex] \implies \\[3ex] h(x) = a(x - 3)^2 + (-9) \\[3ex] h(x) = a(x - 3)^2 - 9 \\[5ex] \text{Passes through the point: } (6, 0) \\[3ex] x = 6 \\[3ex] h(x) = 0 \\[3ex] \implies \\[3ex] 0 = a(6 - 3)^2 - 9 \\[3ex] 0 = a(3)^2 - 9 \\[3ex] 0 = 9a - 9 \\[3ex] 9 = 9a \\[3ex] 9a = 9 \\[3ex] a = \dfrac{9}{9} \\[5ex] a = 1 \\[3ex] \implies \\[3ex] h(x) = a(x - 3)^2 - 9 \\[3ex] h(x) = (x - 3)(x - 3) - 9 \\[3ex] h(x) = x^2 - 3x - 3x + 9 - 9 \\[3ex] h(x) = x^2 - 6x $
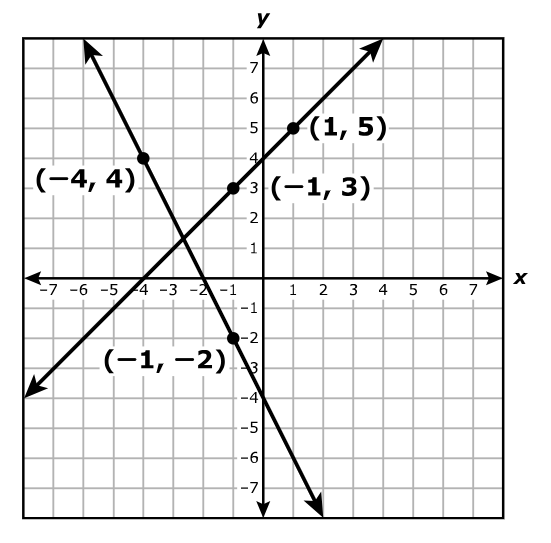
Which system of equations does the graph represent?
$ A.\;\; y = -x - 4 \\[3ex] \hspace{1.6em} y = 2x - 2 \\[5ex] B.\;\; y = -x + 4 \\[3ex] \hspace{1.6em} y = 2x - 4 \\[5ex] C.\;\; y = x - 4 \\[3ex] \hspace{1.6em} y = -2x - 2 \\[5ex] D.\;\; y = x + 4 \\[3ex] \hspace{1.6em} y = -2x - 4 \\[3ex] $
$ m = \text{slope} \\[3ex] b = y-\text{intercept} \\[3ex] y - y_1 = m(x - x_1)...\text{Point–Slope Form} \\[3ex] y = mx + b ...\text{Slope–Intercept Form} \\[5ex] \underline{\text{Line with the positive slope}} \\[3ex] \text{Point 1: } (-1, 3) \\[3ex] x_1 = -1 \\[3ex] y_1 = 3 \\[5ex] \text{Point 2: } (1, 5) \\[3ex] x_2 = 1 \\[3ex] y_2 = 5 \\[5ex] m = \dfrac{y_2 - y_1}{x_2 - x_1} \\[5ex] m = \dfrac{5 - 3}{1 - (-1)} \\[5ex] m = \dfrac{2}{2} \\[5ex] m = 1 \\[5ex] \text{Point–Slope Form} \\[3ex] y - 3 = 1(x - (-1)) \\[3ex] y - 3 = x + 1 \\[5ex] \text{Slope–Intercept Form} \\[3ex] y = x + 1 + 3 \\[3ex] y = x + 4 \\[5ex] \underline{\text{Line with the negative slope}} \\[3ex] \text{Point 1: } (-4, 4) \\[3ex] x_1 = -4 \\[3ex] y_1 = 4 \\[5ex] \text{Point 2: } (5, -3) \\[3ex] x_2 = -1 \\[3ex] y_2 = -2 \\[5ex] m = \dfrac{y_2 - y_1}{x_2 - x_1} \\[5ex] m = \dfrac{-2 - 4}{-1 - (-4)} \\[5ex] m = -\dfrac{-6}{3} \\[5ex] m = -2 \\[5ex] \text{Point–Slope Form} \\[3ex] y - 4 = -2[x - (-4)] \\[3ex] y - 4 = -2(x + 4) \\[3ex] y - 4 = -2x - 8 \\[5ex] \text{Slope–Intercept Form} \\[3ex] y = -2x - 8 + 4 \\[3ex] y = -2x - 4 \\[5ex] \therefore \text{The system of equations shown on the graph is:} \\[3ex] y = x + 4 \\[3ex] y = -2x - 4 $
What is the value of p?
Record your answer in the boxes below.
$ x^p = \left(x^{22}\right)\left(x^7\right)^3 \\[4ex] \text{DISSOCIATE} \\[3ex] = x^{22} \cdot (x^7)^3 \\[4ex] = \text{SOLVE} \\[3ex] = x^{22} \cdot x^{7 \cdot 3} ...\text{Law 5 Exp} \\[4ex] = x^{22} \cdot x^{21} \\[4ex] = x^{22 + 21} ...\text{Law 1 Exp} \\[4ex] = x^{43} \\[4ex] \implies \\[3ex] x^p = x^{43} \\[4ex] \text{Same base; equate exponents} \\[3ex] p = 43 $
Which statement must be true?
A. The slope of the graph of k is $-\dfrac{4}{3}$.
B. The graph of k passes through the point (–1, –8).
C. The zero of k is 7.
D. The x-intercept of the graph of k is –7.
Let us analyze each option.
$ \text{Point 1: } (-7, 0) \\[3ex] x_1 = -7 \\[3ex] y_1 = 0 \\[5ex] \text{Point 2: } (1, 8) \\[3ex] x_2 = 1 \\[3ex] y_2 = 8 \\[5ex] \text{Slope, } m = \dfrac{y_2 - y_1}{x_2 - x_1} \\[5ex] m = \dfrac{8 - 0}{1 - (-7)} \\[5ex] m = \dfrac{8}{8} \\[5ex] m = 1 \\[3ex] $ Optioan A. is incorrect.
Discard.
$ \text{Point–Slope Form and } \text{Slope–Intercept Form} \\[3ex] y - y_1 = m(x - x_1) \\[3ex] y - 0 = 1[x - (-7)] \\[3ex] y = x + 7 \\[5ex] \text{For } (-1, -8) \\[3ex] x = -1 \\[3ex] y = -8 \\[3ex] -8 \stackrel{?}{=} -1 + 7 \\[3ex] -8 \ne 6 \\[3ex] $ Optioan B. is incorrect.
Discard.
$ y = x + 7 \\[3ex] \text{When } y = 0 \\[3ex] 0 = x + 7 \\[3ex] x + 7 = 0 \\[3ex] x = -7 \\[3ex] x-\text{intercept} = (-7, 0) \\[3ex] $ Optioan C. is incorrect.
The zero of k is –7.
Discard.
Optioan D. is the correct answer.
The x-intercept of the graph of k is –7.
A.
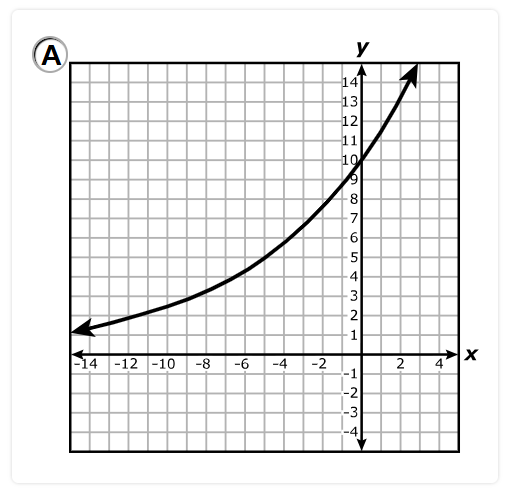
B.
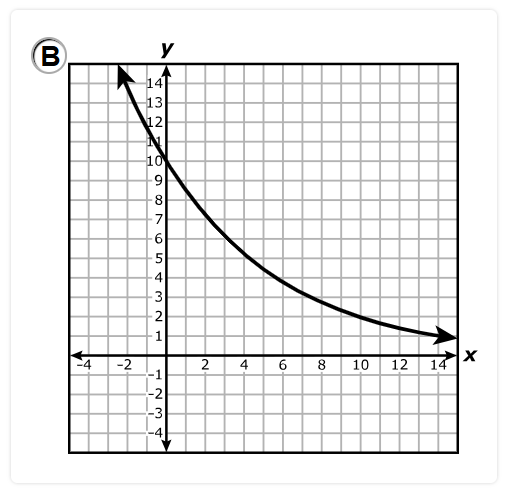
C.
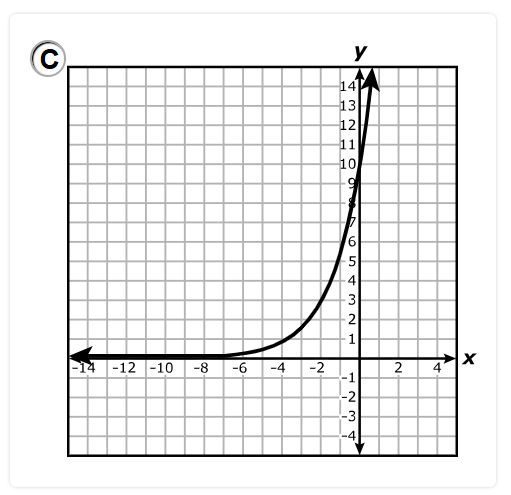
D.
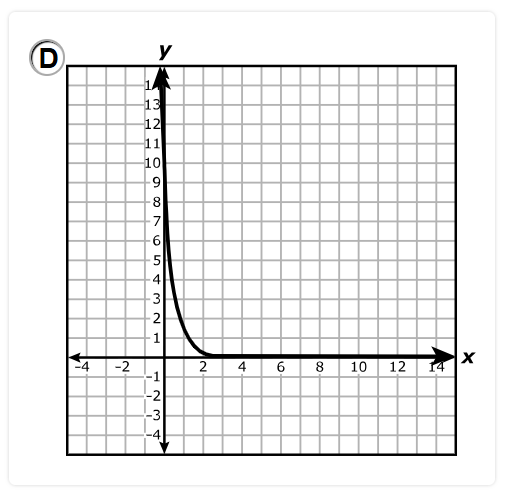
$ y = 10(0.85)^x \\[3ex] \text{Compare to:} \\[3ex] y = ab^x...\text{General Form of an Exponential Function} \\[5ex] a = \text{initial value} = 10 \\[3ex] b = \text{decay factor} = 0.85 \\[3ex] $ Because the decay factor, 0.85 is less than 1, the exponential function is an exponential decay function.
Let us analyze the options.
The initial value is 10.
Discard Option D.
$ \text{ When } x = 1 \\[3ex] y = 10(0.85)^1 \\[3ex] y = 10(0.85) \\[3ex] y = 8.5 \\[3ex] $ Discard Options A. and C.
Option B. is the correct answer.
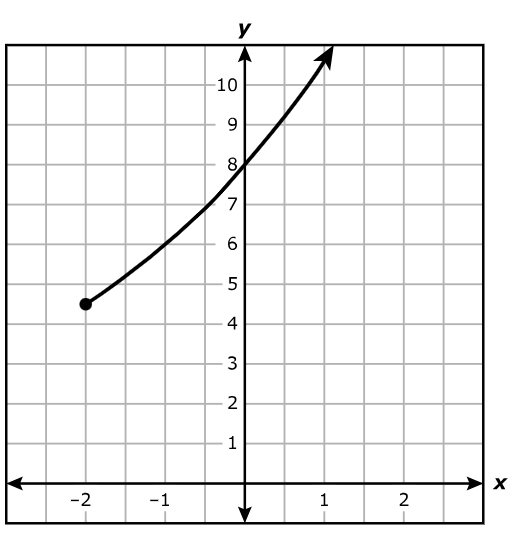
Which inequality best represents the domain of the part shown?
$ A.\;\; x \ge -2 \\[3ex] B.\;\; y \ge 4.5 \\[3ex] C.\;\; x \ge 4.5 \\[3ex] D.\;\; y \ge -2 \\[3ex] $
The domain is the set of all the input values, x for which the function has an output.
The closed circle represents a closed interval. It shows that the end point is included.
On the graph, it is on the left hand side at x = –2
The arrow represents infinity
On the graph, it is on the right hand side.
It represents positive infinity.
So, the interval notation is: $[-2, \infty)$
This represents all real numbers greater than or equal to –2.
$x \ge -2$
Record your answer in the boxes below. Be sure to use the correct place value.
$ -(6m + 8) = 4(17 - m) \\[3ex] -6m - 8 = 68 - 4m \\[3ex] -8 - 68 = -4m + 6m \\[3ex] -76 = 2m \\[3ex] 2m = -76 \\[3ex] m = -\dfrac{76}{2} \\[5ex] m = -38 $
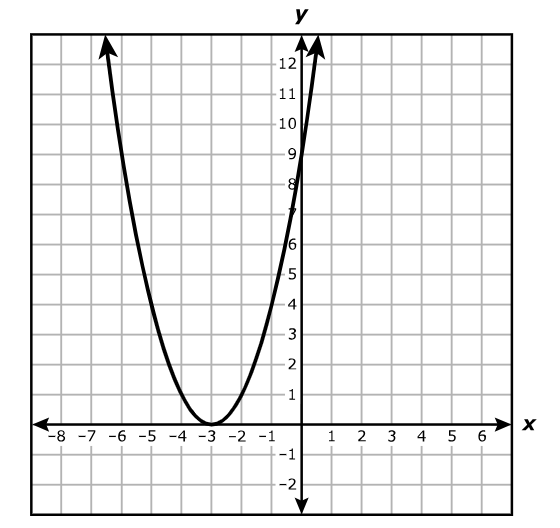
Which statements are best supported by the graph of k?
(I.) The x-intercept is located at (–3, 0).
(II.) The coordinates of the y-intercept are (0, 9).
(III.) The axis of symmetry is x = –3.
A. I and II only.
B. I and III only.
C. II and III only.
D. I, II, and III
The three statements are all supported by the graph of k.
Option D. is the correct answer.
Her combined work schedules consist of no more than 48 hours in one week.
Which graph best represents the solution set for all possible combinations of x, the number of hours she worked at her first job, and y, the number of hours she worked at her second job, in one week?
A.
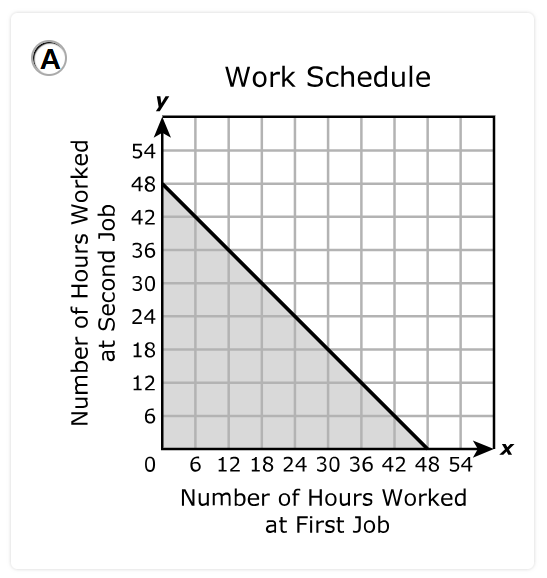
B.
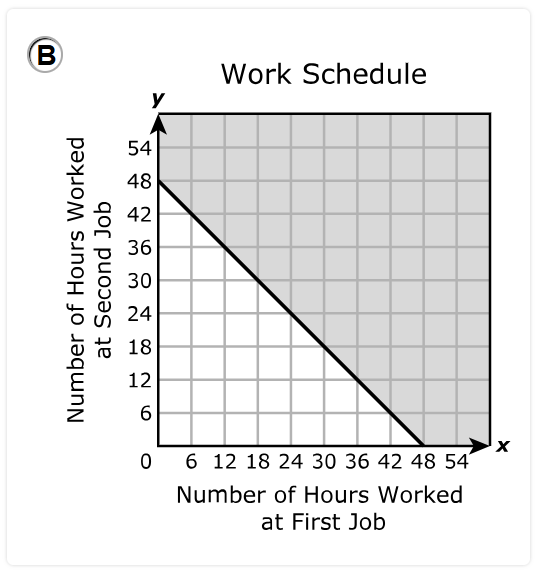
C.
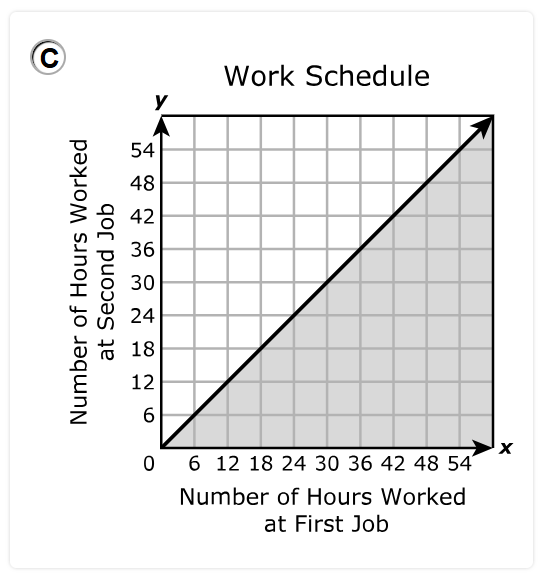
D.
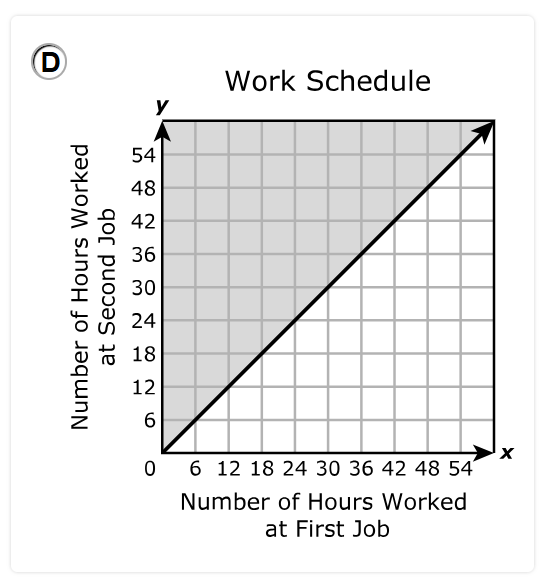
In one week:
x = the number of hours she worked at her first job
y = the number of hours she worked at her second job
Her combined work schedules consist of no more than 48 hours in one week.
⇒ $x + y \le 48$
Because of the equality sign included in the inequality sign, the line drawn will be a solid line.
$ x + y \le 48 \\[5ex] \text{When } x = 0 \\[3ex] 0 + y \le 48 \\[3ex] y \le 48 ...\text{Mark point } (0, 48) \\[3ex] \text{The shaded area is downwards from } y = 48 \\[5ex] \text{When } y = 0 \\[3ex] x + 0 \le 48 \\[3ex] x \le 48 ...\text{Mark point } (48, 0) \\[3ex] \text{The shaded area is to the left of } x = 48 \\[3ex] $ Draw a straight solid line connecting the two points: $(0, 48)$ and $(48, 0)$
Shade the regions accordingly.
Locate the overlap of the two regions.
The correct answer is Option A.
$ 8x - 4y = -16 \\[3ex] 3x + 15y = -6 \\[3ex] $ A.
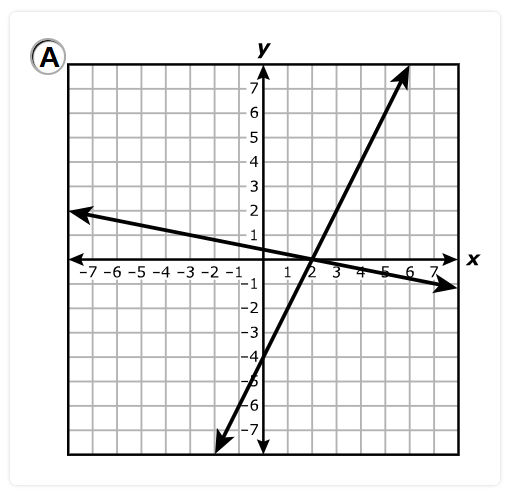
B.
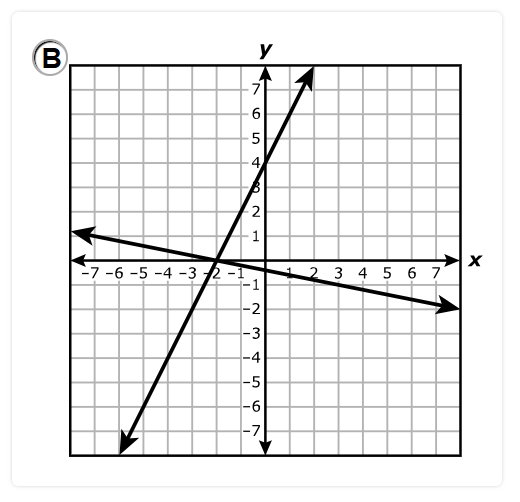
C.
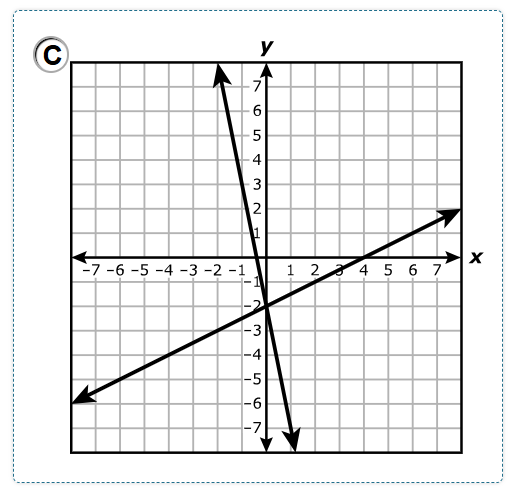
D.
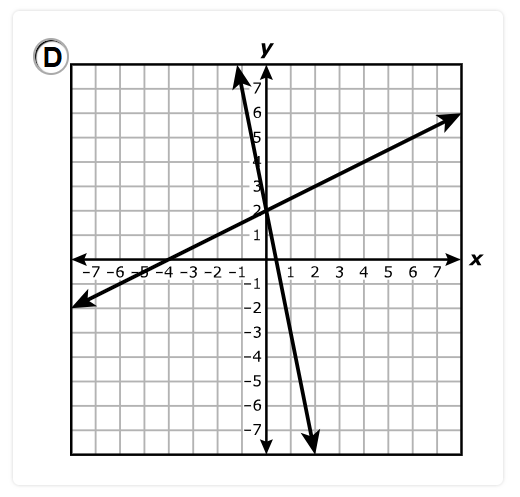
$ \text{Equation 1} \\[3ex] 8x - 4y = -16 \\[3ex] \text{When } x = 0 \\[3ex] 8(0) - 4y = -16 \\[3ex] -4y = -16 \\[3ex] y = \dfrac{-16}{-4} \\[5ex] y = 4 \\[3ex] (x, y) = (0, 4) \\[5ex] \text{When } y = 0 \\[3ex] 8x - 4(0) = -16 \\[3ex] 8x = -16 \\[3ex] x = -\dfrac{16}{8} \\[5ex] x = -2 \\[3ex] (x, y) = (-2, 0) \\[5ex] \text{Equation 2} \\[3ex] 3x + 15y = -6 \\[3ex] \text{When } x = 3 \\[3ex] 3(3) + 15y = -6 \\[3ex] 9 + 15y = -6 \\[3ex] 15y = -6 - 9 \\[3ex] 15y = -15 \\[3ex] y = -\dfrac{15}{15} \\[5ex] y = -1 \\[3ex] (x, y) = (3, -1) \\[5ex] \text{When } y = 0 \\[3ex] 3x + 15(0) = -6 \\[3ex] 3x = -6 \\[3ex] x = -\dfrac{6}{3} \\[5ex] x = -2 \\[3ex] (x, y) = (-2, 0) \\[3ex] $ The correct answer is Option B.
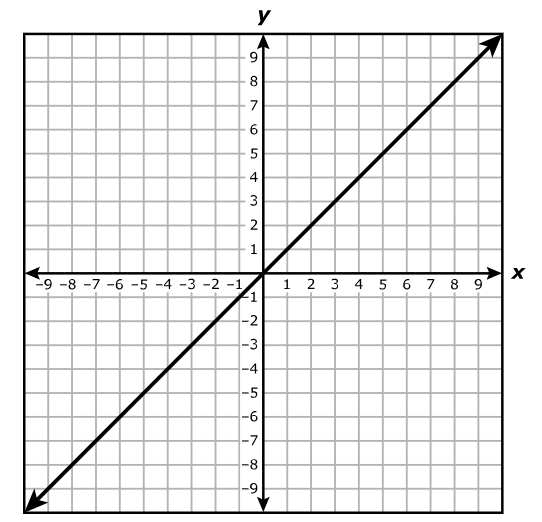
Which graph best represents $h(x) = -f(x) + 3$?
A.
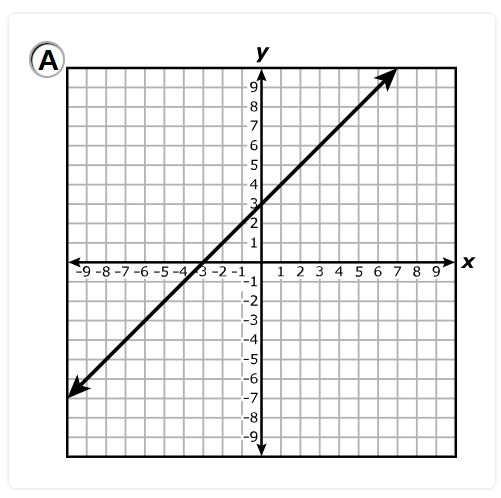
B.
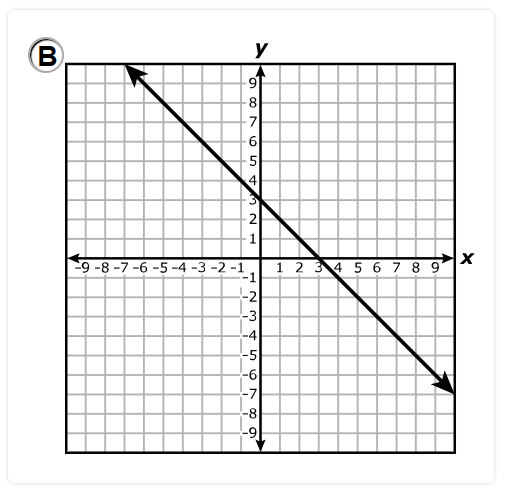
C.
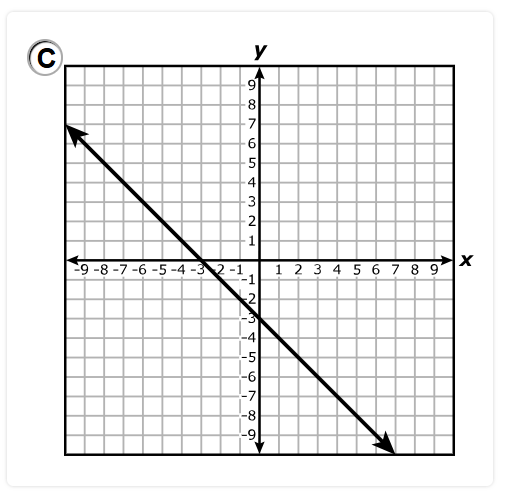
D.
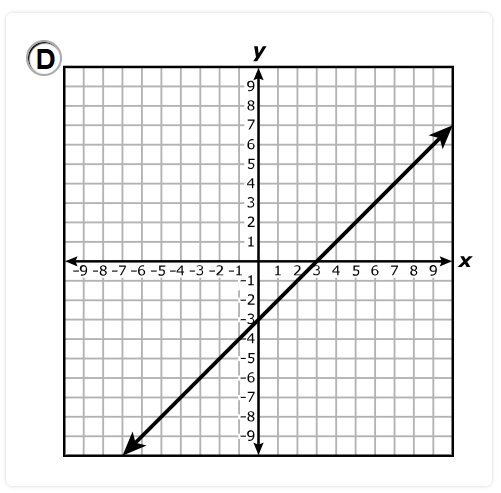
Parent Function: $f(x) = x$
Origin = (0, 0)
Another Point = (3, 3)
Child Function: $h(x) = -f(x) + 3$
1st Transformation: Vertical Reflection
$ (0, 0) \rightarrow (0, –0) \rightarrow (0, 0) \\[3ex] (3, 3) \rightarrow (3, –3) \\[3ex] $ 2nd Transformation: Vertical Shift 3 units up
$ (0, 0) \rightarrow (0, 0 + 3) \\[3ex] \hspace{2em} \rightarrow (0, 3) \\[5ex] (3, –3) \rightarrow (3, -3 + 3) \\[3ex] \hspace{2em} \rightarrow (3, 0) \\[3ex] $ Can we locate these points (0, 3) and (3 0) on the graph of the transformation?
The correct answer is Option B.
A.
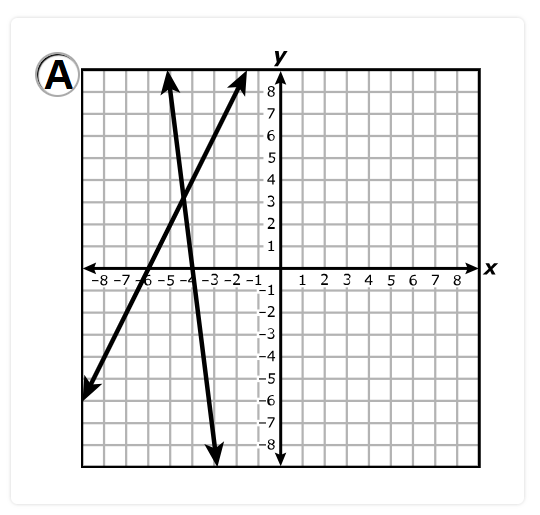
B.
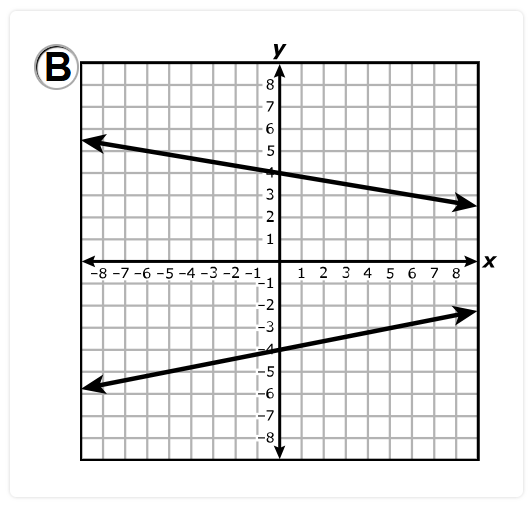
C.
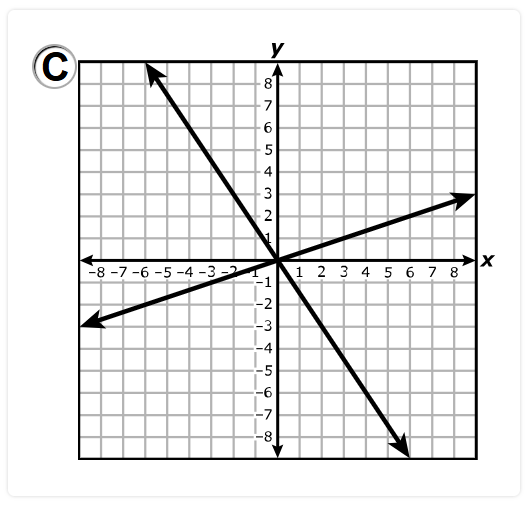
D.
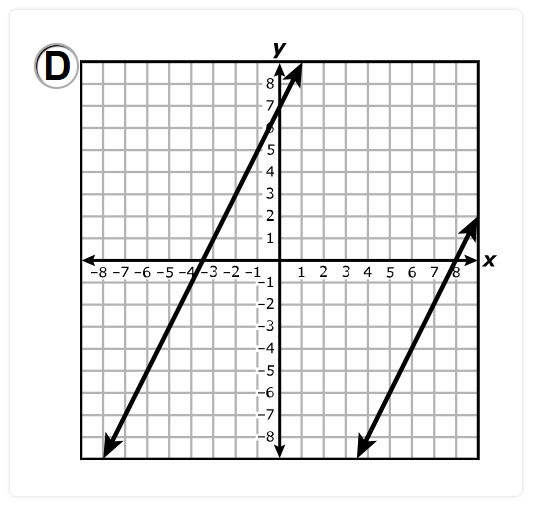
The graph that has no solution is the one with two parallel lines.
This is because parallel lines do not meet/intersect, so there is no intersection of the lines where a solution is found.
The correct answer is Option D.
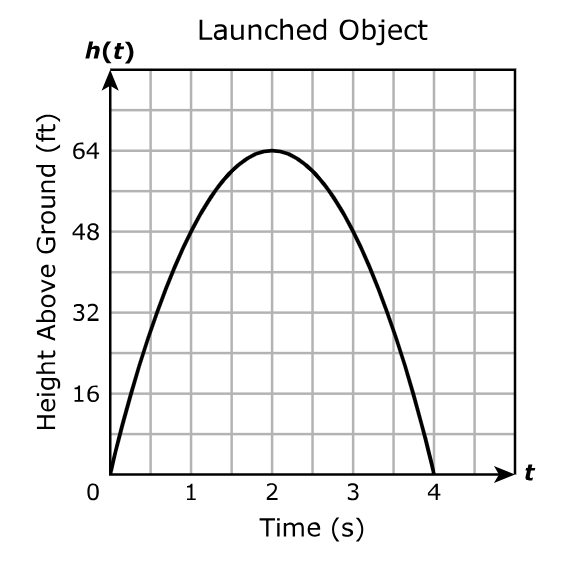
Which function is best represented by the graph of this situation?
$ A.\;\; h(t) = -16t^2 - 64t \\[3ex] B.\;\; h(t) = -16t^2 + 128t - 256 \\[3ex] C.\;\; h(t) = -16t^2 + 64t \\[3ex] D.\;\; h(t) = -16t^2 - 128t - 256 \\[3ex] $
We can solve the question using at least two approaches.
Use any approach you prefer.
$ \text{Let}: \\[3ex] h(t) = f(x) \\[3ex] t = x \\[3ex] a = \text{leading coefficient} \\[5ex] \underline{\text{1st Approach: Equation of a Quadratic Function in Factored Form}} \\[3ex] f(x) = a(x - \alpha)(x - \beta) \\[3ex] \alpha, \beta = \text{zeros of the function} \\[3ex] \alpha = 0 \\[3ex] \beta = 4 \\[3ex] \implies \\[3ex] f(x) = a(x - 0)(x - 4) \\[3ex] f(x) = a(x)(x - 4) \\[5ex] \text{Passes through the point (vertex) } (2, 64) \\[3ex] x = 2 \\[3ex] f(x) = 64 \\[3ex] \implies \\[3ex] 64 = a(2)(2 - 4) \\[3ex] 64 = a(2)(-2) \\[3ex] 64 = -4a \\[3ex] -4a = 64 \\[3ex] a = \dfrac{64}{-4} \\[5ex] a = -16 \\[5ex] \implies \\[3ex] f(x) = -16(x)(x - 4) \\[3ex] f(x) = -16x(x - 4) \\[3ex] f(x) = -16x^2 + 64x \\[3ex] \implies \\[3ex] h(t) = -16t^2 + 64t \\[5ex] \underline{\text{2nd Approach: Equation of a Quadratic Function in Vertex Form}} \\[3ex] f(x) = a(x - h)^2 + k ...\text{where } (h, k) \text{ is the vertex} \\[3ex] (h, k) = (2, 64) \\[3ex] h = 2 \\[3ex] k = 64 \\[3ex] \implies \\[3ex] f(x) = a(x - 2)^2 + 64 \\[5ex] \text{Passes through the point: } (4, 0) \\[3ex] x = 4 \\[3ex] f(x) = 0 \\[3ex] \implies \\[3ex] 0 = a(4 - 2)^2 + 64 \\[3ex] 0 - 64 = a(2)^2 \\[3ex] -64 = 4a \\[3ex] 4a = -64 \\[3ex] a = \dfrac{-64}{4} \\[5ex] a = -16 \\[5ex] \implies \\[3ex] f(x) = -16(x - 2)^2 + 64 \\[3ex] f(x) = -16[(x - 2)(x - 2)] + 64 \\[3ex] f(x) = -16(x^2 - 2x - 2x + 4) + 64 \\[3ex] f(x) = -16(x^2 - 4x + 4) + 64 \\[3ex] f(x) = -16x^2 + 64x - 64 + 64 \\[3ex] f(x) = -16x^2 + 64x \\[3ex] \implies \\[3ex] h(t) = -16t^2 + 64t $
The table scatterplot show the percentage of the baby rhinoceros's body mass that was used to determine the amount of food given at each feeding as a linear function of its age in weeks.
| Age (weeks) | 1 | 2 | 4 | 7 | 9 | 12 | 14 | 15 | 17 | 20 |
| Percentage of Body Mass | 20 | 19.5 | 17 | 15 | 14 | 13.5 | 12.4 | 11.6 | 11 | 9 |
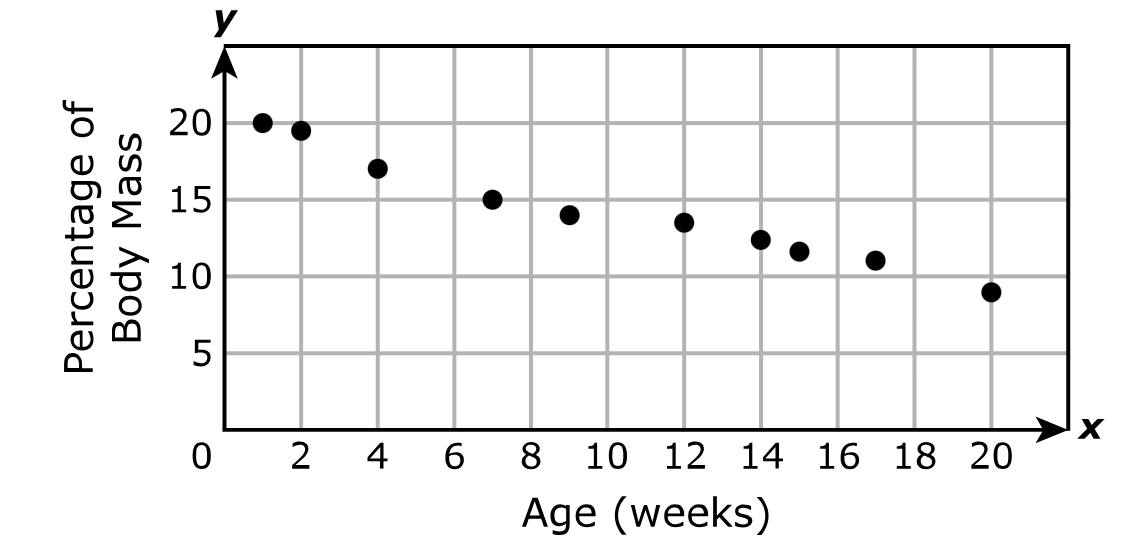
What is the best prediction of the percentage of the body rhinoceros's body mass that should be used to determine the amount of food given at each feeding when it is 25 weeks old?
$ A.\;\; 8.5\% \\[3ex] B.\;\; 6\% \\[3ex] C.\;\; 2.5\% \\[3ex] D.\;\; 10\% \\[3ex] $
$ \underline{\text{Linear Function}} \\[3ex] \text{slope} = m \\[5ex] \text{Point 1: } (1, 20) \\[3ex] x_1 = 1 \\[3ex] y_1 = 20 \\[5ex] \text{Point 2: } (20, 9) \\[3ex] x_2 = 20 \\[3ex] y_2 = 9 \\[5ex] m = \dfrac{y_2 - y_1}{x_2 - x_1} \\[5ex] m = \dfrac{9 - 20}{20 - 1} \\[5ex] m = -\dfrac{11}{19} \\[5ex] \text{Point–Slope Form} \\[3ex] y - y_1 = m(x - x_1) \\[3ex] y - 20 = -\dfrac{11}{19}(x - 1) \\[5ex] y - 20 = -\dfrac{11}{19}x + \dfrac{11}{19} \\[5ex] \text{Slope–Intercept Form} \\[3ex] y = -\dfrac{11}{19}x + \dfrac{11}{19} + 20 \\[5ex] y = -\dfrac{11}{19}x + \dfrac{11}{19} + \dfrac{380}{19} \\[5ex] y = -\dfrac{11}{19}x + \dfrac{391}{19} \\[5ex] \text{When } x = 25 \\[3ex] y = -\dfrac{11}{19} * 25 + \dfrac{391}{19} \\[5ex] y = -\dfrac{275}{19} + \dfrac{391}{19} \\[5ex] y = \dfrac{116}{19} \\[5ex] y = 6.105263158\% $
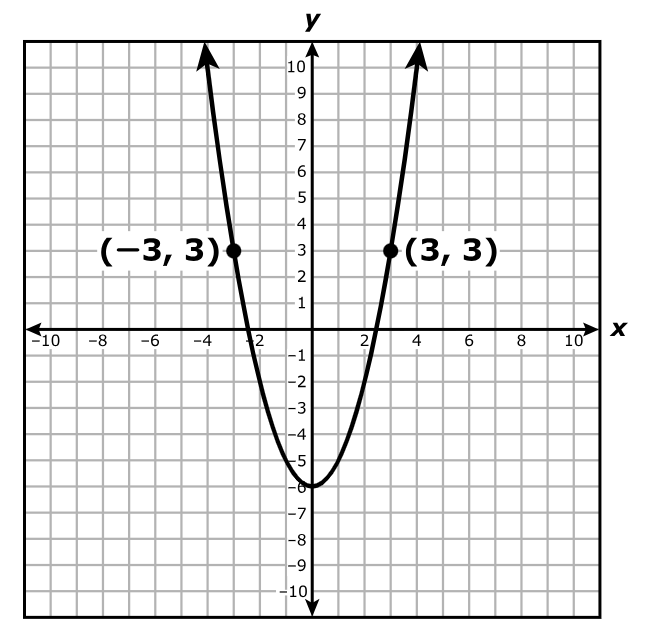
If $k(x) = x^2$ and $p(x) = k(x) + n$, what is the value of n?
Record your answer in the boxes below.
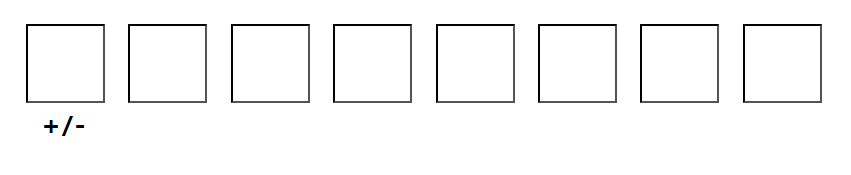
Let us find the graph of p
$ \underline{\text{Equation of a Quadratic Function in Vertex Form}} \\[3ex] p(x) = a(x - h)^2 + k ...\text{where } (h, k) \text{ is the vertex} \\[3ex] (h, k) = (0, -6) \\[3ex] h = 0 \\[3ex] k = -6 \\[3ex] \implies \\[3ex] p(x) = a(x - 0)^2 + -6 \\[3ex] p(x) = ax^2 - 6 \\[5ex] \text{Passes through the point: } (3, 3) \\[3ex] x = 3 \\[3ex] p(x) = 3 \\[3ex] \implies \\[3ex] 3 = a(3)^2 - 6 \\[3ex] 3 = 9a - 6 \\[3ex] 9a - 6 = 3 \\[3ex] 9a = 3 + 6 \\[3ex] 9a = 9 \\[3ex] a = \dfrac{9}{9} \\[5ex] a = 1 \\[5ex] \implies \\[3ex] p(x) = x^2 - 6 \\[5ex] \text{But} \\[3ex] k(x) = x^2 \\[3ex] p(x) = k(x) + n \\[3ex] \implies \\[3ex] x^2 - 6 = x^2 + n \\[5ex] -6 = n \\[3ex] n = -6 $
The graph models the linear relationship between the water level of the river in feet and the number of days the water level was measured.
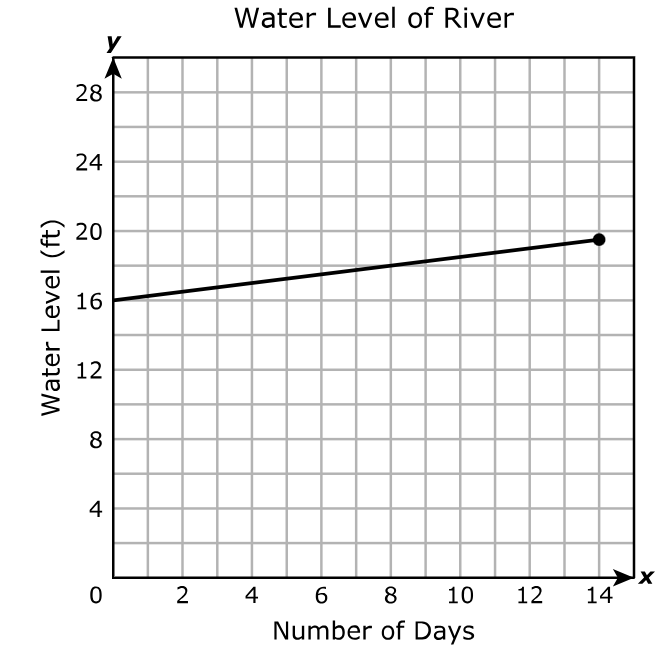
Which statement best describes the y-intercept of the graph?
A. The water level increased by 0.25 ft per day.
B. The maximum water level was 19.5 ft.
C. The initial water level was 16 ft.
D. The water level was measured for 14 days.
The y-intercept is the point where the graph intersects the y-axis.
At the y-intercept, x = 0
The graph intersects the y-axis at (0, 16)
This implies that: The initial water level was 16 ft.
A.
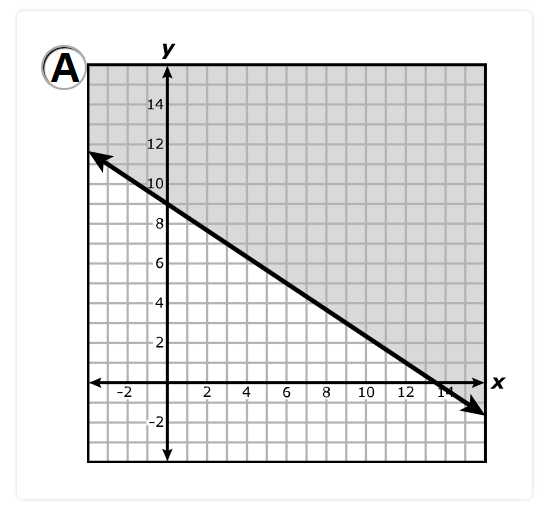
B.
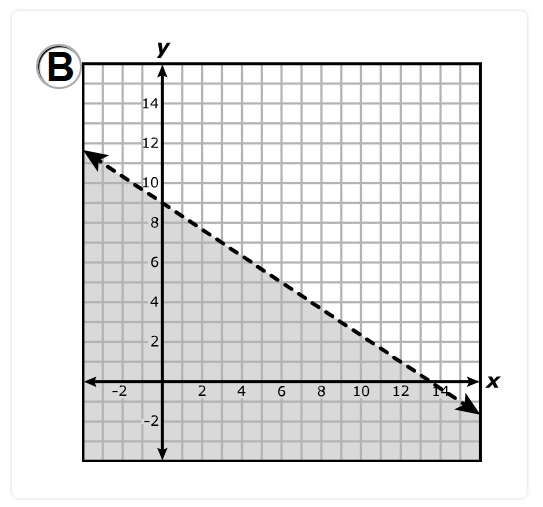
C.
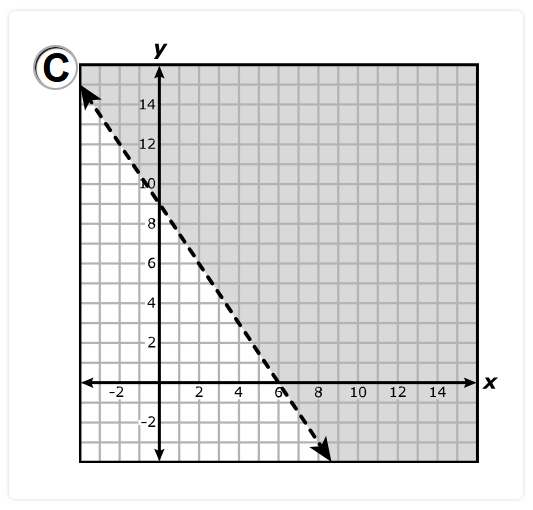
D.
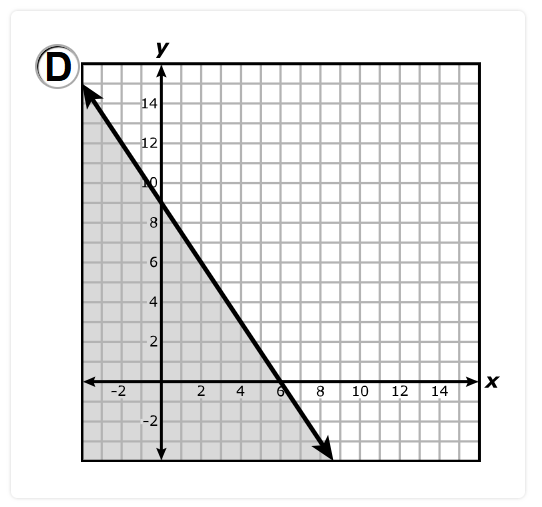
Because the inequality contains an equal sign, the line will be a solid line.
$ -4x \le 6y - 54 \\[5ex] \text{When } x = 0 \\[3ex] -4(0) \le 6y - 54 \\[3ex] 0 \le 6y - 54 \\[3ex] 6y - 54 \ge 0...\text{Swapping LHS and RHS} \\[3ex] 6y \ge 0 + 54 \\[3ex] 6y \ge 54 \\[3ex] y \ge \dfrac{54}{6} \\[5ex] y \gt 9 ...\text{Mark point } (0, 9) \\[3ex] \text{The shaded area is upwards from } y = 9 \\[5ex] \text{When } y = 0 \\[3ex] -4x \le 6(0) - 54 \\[3ex] -4x \le -54 \\[3ex] x \ge \dfrac{-54}{-4}...\text{Division by a negative} \\[5ex] x \ge 13.5 ...\text{Mark point } (13.5, 0) \\[3ex] \text{The shaded area is to the right of } x = 13.5 \\[3ex] $ Draw a straight dashed line connecting the two points: $(0, 9)$ and $(13.5, 0)$
Shade the regions accordingly.
Locate the overlap of the two regions.
The correct answer is Option A.
Record your answer in the boxes below.
$ f(x) = \dfrac{1}{3}(4 - x)^2 \\[5ex] f(16) = \dfrac{1}{3} * (4 - 16)^2 \\[5ex] = \dfrac{1}{3} * (-12)^2 \\[5ex] = \dfrac{1}{3} * 144 \\[5ex] = 48 $
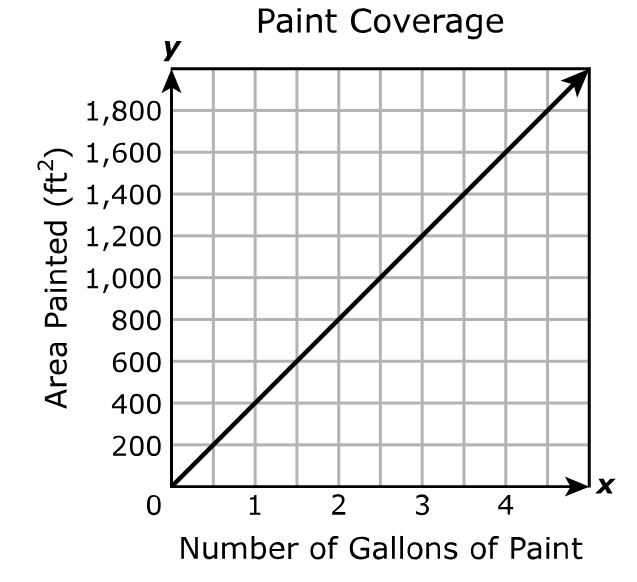
Which of these best represents the rate of change of the maximum area painted with respect to the number of gallons of paint used?
$ A.\;\; 200ft^2/gal \\[4ex] B.\;\; \dfrac{1}{200}ft^2/gal \\[5ex] C.\;\; 400ft^2/gal \\[4ex] D.\;\; \dfrac{1}{400}ft^2/gal \\[5ex] $
The rate of change of the maximum area painted with respect to the number of gallons of paint used is the slope of the linear function.
$ \text{Point 1: } (0, 0) \\[3ex] x_1 = 0 \\[3ex] y_1 = 0 \\[5ex] \text{Point 2: } (4, 1600) \\[3ex] x_2 = 4 \\[3ex] y_2 = 1600 \\[5ex] \text{Slope, } m = \dfrac{y_2 - y_1}{x_2 - x_1} \\[5ex] m = \dfrac{1600 - 0}{4 - 0} \\[5ex] m = \dfrac{1600}{4} \\[5ex] m = 400 \\[3ex] $ The rate of change of the maximum area painted with respect to the number of gallons of paint used is 400 square feet per gallon.
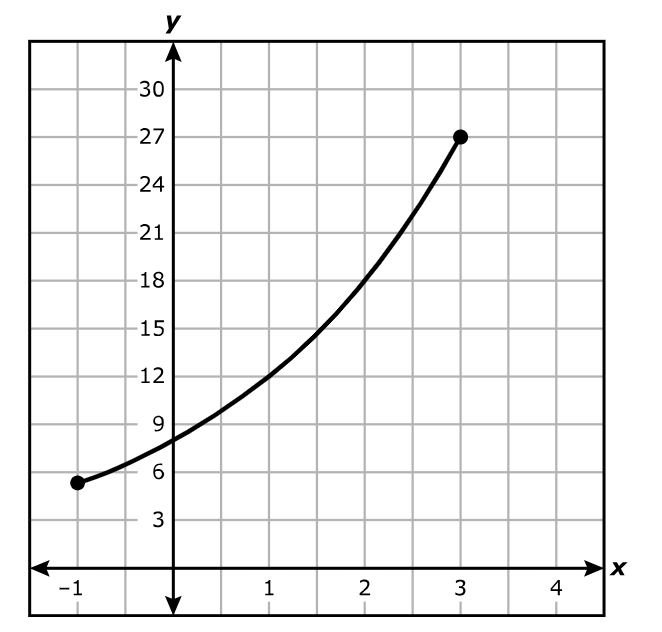
$ A.\;\; -1 \le x \le 3 \\[3ex] B.\;\; -1 \le y \le 3 \\[3ex] C.\;\; 5.3 \le x \le 27 \\[3ex] D.\;\; 5.3 \le y \le 27 \\[3ex] $
The domain is the set of all the input values, x for which the function has an output.
The closed circle represents a closed interval. It shows that the endpoint is included.
On the graph:
The closed circle on the left hand side is at x = –1
The closed circle on the right hand side is at x = 3
The interval notation is: [–1, 3]
The set notation is: Domain = $\{x: -1 \le x \le 3 \}$
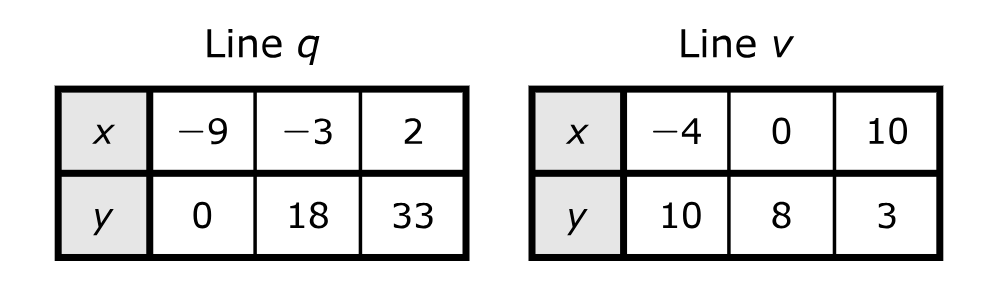
Which system of equations is represented by lines q and v?
$ A.\;\; 21x - y = 9 \\[3ex] \hspace{1.6em} 5x + 6y = 40 \\[5ex] B.\;\; 3x - y = -27 \\[3ex] \hspace{1.6em} x + 2y = 16 \\[5ex] C.\;\; 21x - y = 9 \\[3ex] \hspace{1.6em} 5x + 6y = 20 \\[5ex] D.\;\; 9x - y = -27 \\[3ex] \hspace{1.6em} x + 2y = 8 \\[3ex] $
$ \text{slope} = m \\[3ex] y - y_1 = m(x - x_1)...\text{Point–Slope Form} \\[3ex] y = mx + b ...\text{Slope–Intercept Form} \\[3ex] Ax + By = C ...\text{where } A \gt 0 ...\text{Standard Form} \\[5ex] \underline{\text{Line q}} \\[3ex] \text{Point 1: } (-9, 0) \\[3ex] x_1 = -9 \\[3ex] y_1 = 0 \\[5ex] \text{Point 2: } (2, 33) \\[3ex] x_2 = 2 \\[3ex] y_2 = 33 \\[5ex] m = \dfrac{y_2 - y_1}{x_2 - x_1} \\[5ex] m = \dfrac{33 - 0}{2 - (-9)} \\[5ex] m = \dfrac{33}{11} \\[5ex] m = 3 \\[5ex] \text{Point–Slope Form} \\[3ex] y - 0 = 3[x - (-9)] \\[3ex] y = 3(x + 9) \\[5ex] \text{Slope–Intercept Form} \\[3ex] y = 3x + 27 \\[5ex] \text{Standard Form} \\[3ex] -27 = 3x - y \\[3ex] 3x - y = -27 \\[5ex] \underline{\text{Line v}} \\[3ex] \text{Point 1: } (-4, 10) \\[3ex] x_1 = -4 \\[3ex] y_1 = 10 \\[5ex] \text{Point 2: } (10, 3) \\[3ex] x_2 = 10 \\[3ex] y_2 = 3 \\[5ex] m = \dfrac{y_2 - y_1}{x_2 - x_1} \\[5ex] m = \dfrac{3 - 10}{10 - (-4)} \\[5ex] m = \dfrac{-7}{14} \\[5ex] m = -\dfrac{1}{2} \\[5ex] \text{Point–Slope Form} \\[3ex] y - 10 = -\dfrac{1}{2}[x - (-4)] \\[5ex] y - 10 = -\dfrac{1}{2}(x + 4) \\[5ex] y - 10 = -\dfrac{1}{2}x - 2 \\[5ex] \text{Slope–Intercept Form} \\[3ex] y = -\dfrac{1}{2}x - 2 + 10 \\[5ex] y = -\dfrac{1}{2}x + 8 \\[5ex] \text{Standard Form} \\[3ex] \text{LCD} = 2 \\[3ex] 2y = 2\left(-\dfrac{1}{2}x\right) + 2(8) \\[5ex] 2y = -x + 16 \\[3ex] 2y + x = 16 \\[3ex] x + 2y = 16 \\[5ex] \therefore \text{The system of equations shown on the graph is:} \\[3ex] 3x - y = -27 \\[3ex] x + 2y = 16 $
The height of the paper airplane above the ground can be found using the function $y = -1.5x + 60$, where x is the time in seconds the airplane has been in the air.
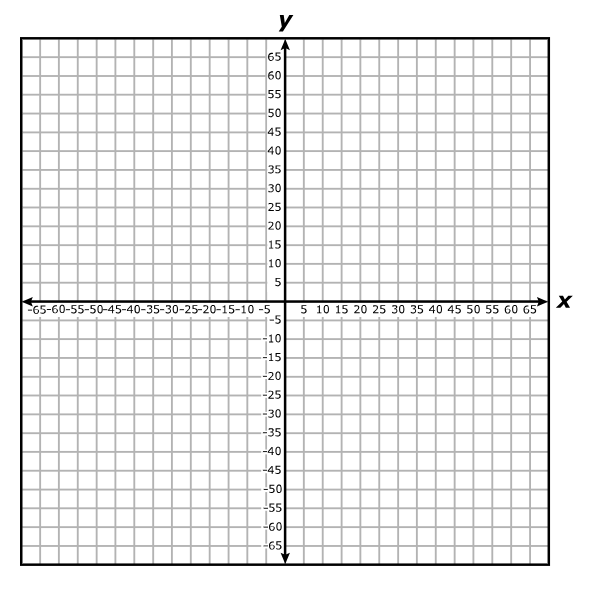
How many seconds did it take the paper airplane to reach the ground?
Record your answer in the boxes below.
When the paper airplane reaches the ground, the height is zero.
Hence, to find the time it takes to reach the ground,
$ y = -1.5x + 60 \\[3ex] 0 = -1.5x + 60 \\[3ex] 1.5x = 60 \\[3ex] x = \dfrac{60}{1.5} \\[5ex] x = 40 \\[3ex] $ It takes the paper airplane 40 seconds to reach the ground.
A.
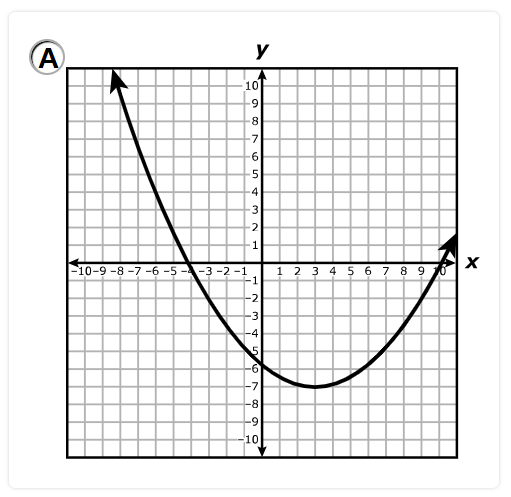
B.
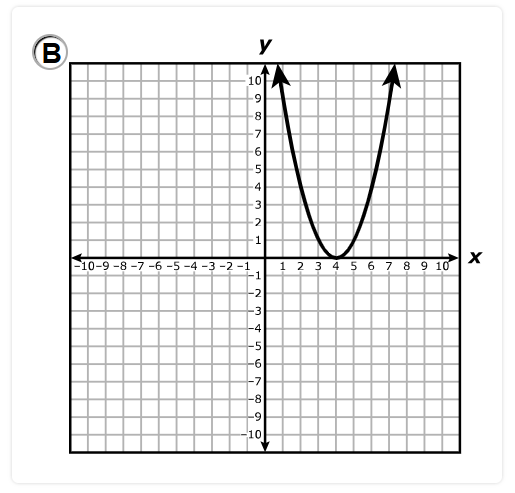
C.
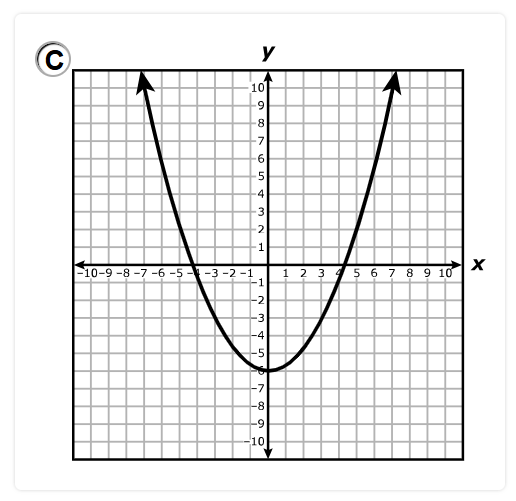
D.
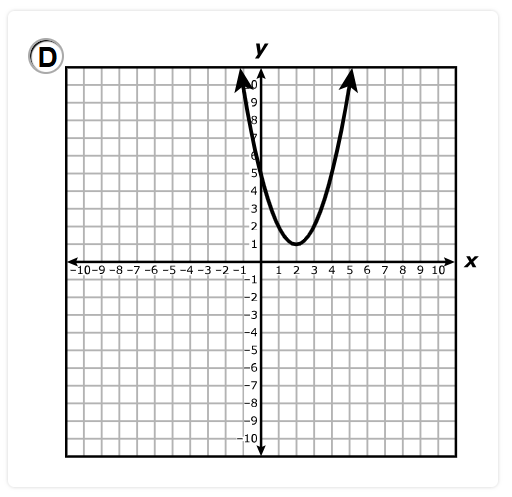
The zero of the function is the value of the x when y = 0
It is the x value where the graph intersects (touches or crosses) the x-axis.
Option A: The graph has two zeros.
Discard.
Option B: The graph has one zero.
This is the correct answer.
Option C: The graph has two zeros.
Discard.
Option D: The graph has no zero.
Discard.
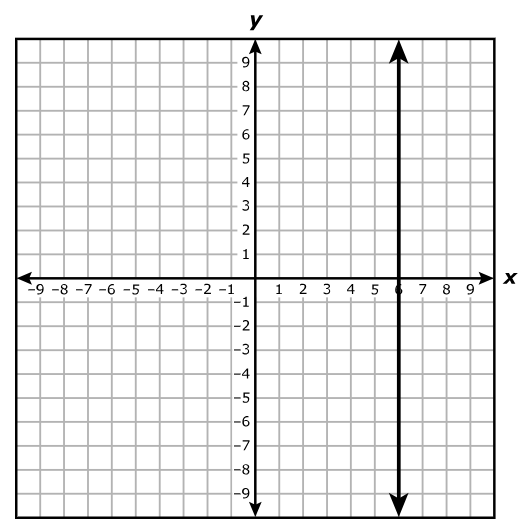
$ A.\;\; y = 6; \text{ slope is } -\dfrac{1}{6}. \\[5ex] B.\;\; x = 6; \text{ slope is zero}. \\[3ex] C.\;\; y = 6; \text{ slope is } 6. \\[3ex] D.\;\; x = 6; \text{ slope is undefined}. \\[3ex] $
The answer is Option D.
x = 6
The slope of any vertical line is undefined.
Student: SamDom, could you explain why the slope of a vertical line is undefined?
Teacher: Sure.
Let's do it.
$ m = \text{slope} = \dfrac{y_2 - y_1}{x_2 - x_1} \\[5ex] \underline{\text{Vertical Line}} \\[3ex] \text{Point 1: } (6, -8) \\[3ex] x_1 = 6 \\[3ex] y_1 = -8 \\[5ex] \text{Point 2: } (6, 8) \\[3ex] x_2 = 6 \\[3ex] y_2 = 8 \\[5ex] m = \dfrac{8 - (-8)}{6 - 6} \\[5ex] m = \dfrac{16}{0} \\[5ex] m = \text{undefined...division by zero} $
Record your answer in the boxes below.
$ 34x + 95 = 3(14x + 9) \\[3ex] 34x + 95 = 42x + 27 \\[3ex] 95 - 27 = 42x - 34x \\[3ex] 68 = 8x \\[3ex] 8x = 68 \\[3ex] x = \dfrac{68}{8} \\[5ex] x = 8.5 $
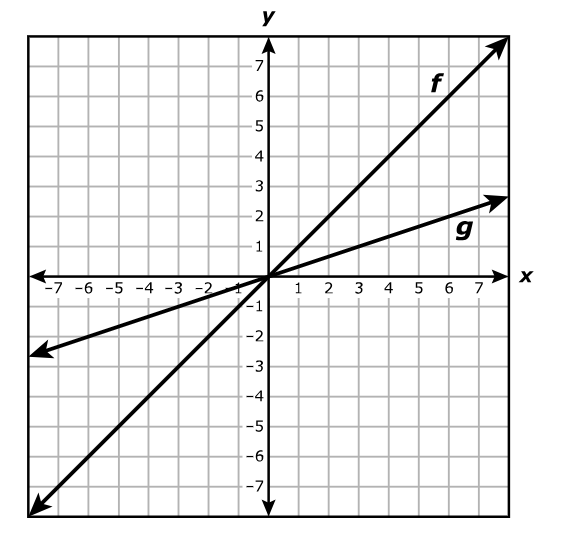
Which function is best represented by the graph of g?
$ A.\;\; g(x) = f(x) - 4 \\[3ex] B.\;\; g(x) = \dfrac{1}{3}f(x) \\[5ex] C.\;\; g(x) = f(x) - 2 \\[3ex] D.\;\; g(x) = 3f(x) \\[3ex] $
Let us analyze each option.
Before we do so, let us look for integer coordinates for both graphs f and g
At least two points are sufficient to see a pattern.
| Parent Function, $f(x)$ | Child (Transformed) Function, $g(x)$ |
|---|---|
| (3, 3) | (3, 1) |
| (6, 6) | (6, 2) |
|
We notice that:
x-ccordinates are the same. y-ccordinates change, hence it is a vertical transformation. $ \dfrac{1}{3} * 3 = 1 \\[5ex] \dfrac{1}{3} * 6 = 2 \\[5ex] \therefore, \dfrac{1}{3} * f(x) = g(x) \\[5ex] g(x) = \dfrac{1}{3}f(x) $ |
|
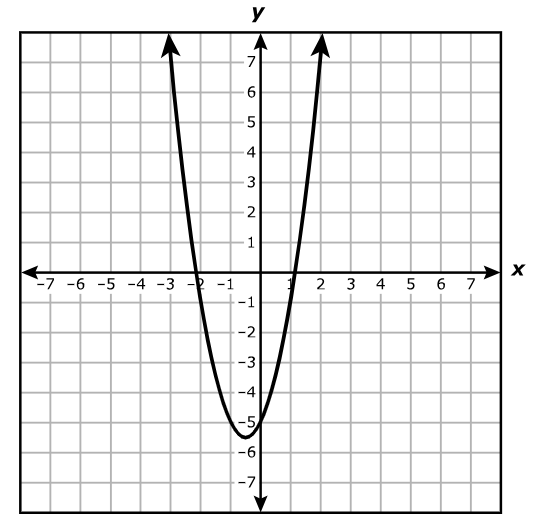
Which of these best represents the domain of f?
$ A.\;\; -3 \le x \le 2 \\[3ex] B.\;\; \text{All real numbers} \\[3ex] C.\;\; y \ge 5.5 \\[3ex] D.\;\; \text{All real numbers less than } -3 \text{ or greater than } 2 \\[3ex] $
The domain is the set of all the input values, x for which the function has an output.
The arrow represents infinity (positive or negative infinity as applicable).
On the graph, the domain has arrows on both the LHS (Left Hand Side) and the RHS (Right Hand Side).
This means that the domain includes both positive infinity and negative infinity.
Therefore, the domain is all real numbers.
A.
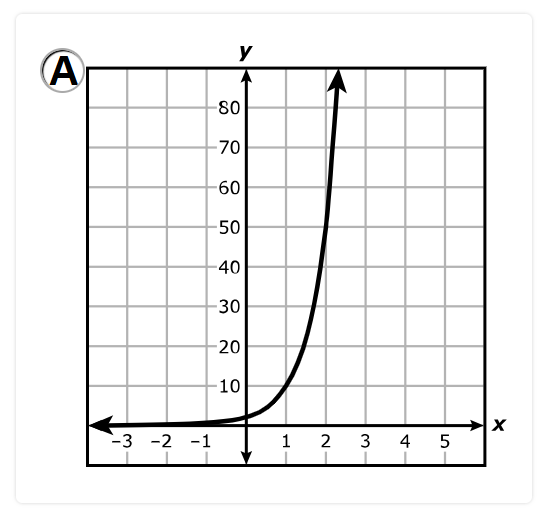
B.
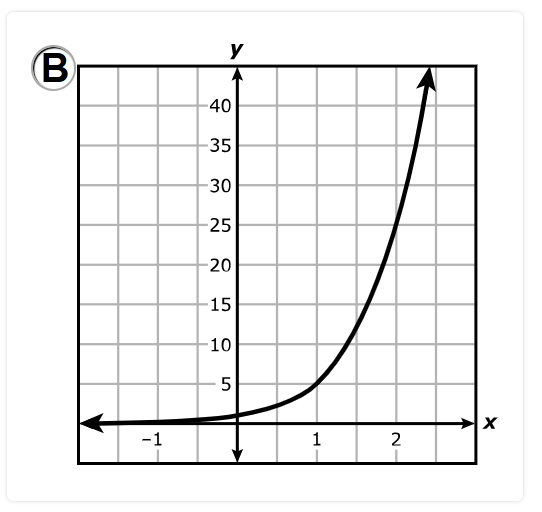
C.
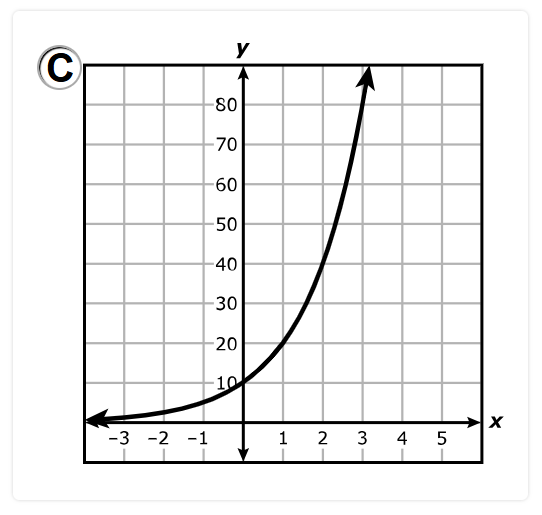
D.
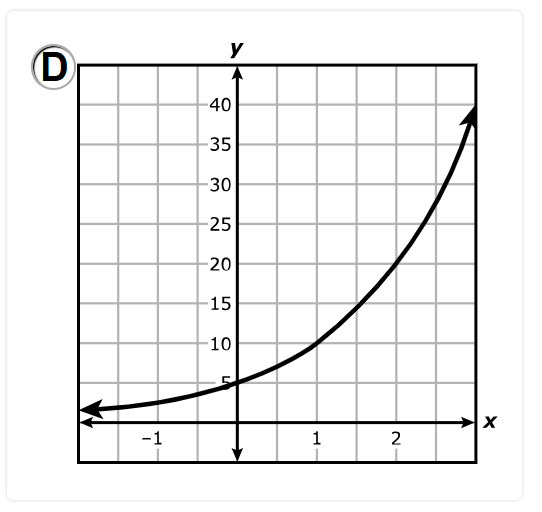
$ y = 2(5)^x \\[3ex] \text{Compare to:} \\[3ex] y = ab^x...\text{General Form of an Exponential Function} \\[5ex] a = \text{initial value} = 2 \\[3ex] b = \text{growth factor} = 5 \\[3ex] $ Because the growth factor, 5 is greater than 1, the exponential function is an exponential growth function.
Let us analyze the options.
The initial value is 2.
Discard Option C.
Discard Option D.
$ \text{ When } x = 1 \\[3ex] y = 2(5)^1 \\[3ex] y = 2(5) \\[3ex] y = 10 \\[3ex] $ Discard Option B.
Option A. is the correct answer.
| Week | 0 | 1 | 3 | 6 | 8 | 13 |
| Balance (dollars) | 32 | 39 | 53 | 74 | 88 | 123 |
Based on the table, what was the rate of change of the balance of the student's savings account in dollars and cents per week?
Record your answer in the boxes below. Be sure to use the correct place value.
The rate of change of the balance of the student's savings account in dollars and cents per week is the slope of the linear function.
$ \text{Point 1: } (0, 32) \\[3ex] x_1 = 0 \\[3ex] y_1 = 32 \\[5ex] \text{Point 2: } (13, 123) \\[3ex] x_2 = 13 \\[3ex] y_2 = 123 \\[5ex] \text{Slope, } m = \dfrac{y_2 - y_1}{x_2 - x_1} \\[5ex] m = \dfrac{123 - 32}{13 - 0} \\[5ex] m = \dfrac{91}{13} \\[5ex] m = 7 \\[3ex] m = \$7.00 \\[3ex] $ The rate of change of the balance of the student's savings account in dollars and cents per week is 7 dollars and 0 cents per week.
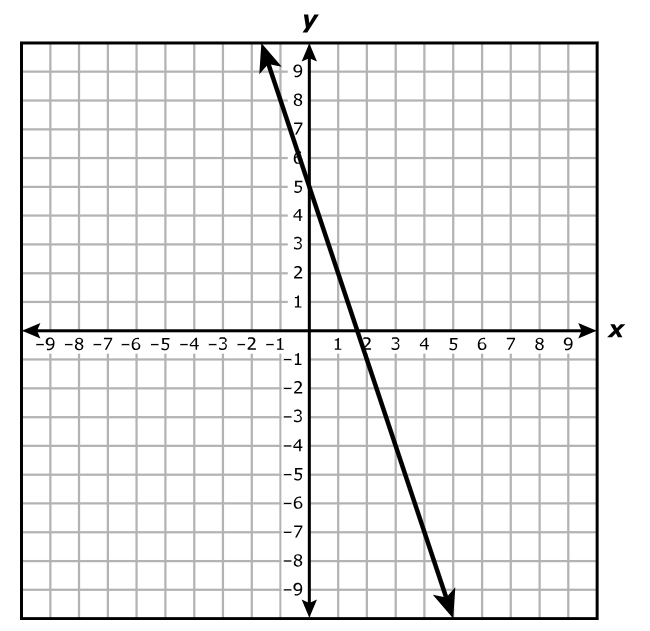
Which equation is best represented by this graph?
$ A.\;\; y + 7 = -3(x - 4) \\[3ex] B.\;\; y + 1 = -3(x + 2) \\[3ex] C.\;\; y - 4 = 3(x + 7) \\[3ex] D.\;\; y - 2 = 3(x - 1) \\[3ex] $
$ \text{Slope–Intercept Form: } y = mx + b \\[5ex] m = \text{slope} \\[3ex] b = y-\text{intercept} = 5 \\[5ex] \text{Point 1: } (0, 5) \\[3ex] x_1 = 0 \\[3ex] y_1 = 5 \\[5ex] \text{Point 2: } (3, -4) \\[3ex] x_2 = 3 \\[3ex] y_2 = -4 \\[5ex] m = \dfrac{y_2 - y_1}{x_2 - x_1} \\[5ex] m = \dfrac{-4 - 5}{3 - 0} \\[5ex] m = \dfrac{-9}{3} \\[5ex] m = -3 \\[5ex] \text{Slope–Intercept Form} \\[3ex] y = -3x + 5 \\[5ex] \underline{\text{Test Options}} \\[3ex] \text{Option A.} \\[3ex] \text{Add 7 to both sides and factorize} \\[3ex] y + 7 = -3x + 5 + 7 \\[3ex] y + 7 = -3x + 12 \\[3ex] y + 7 = -3(x - 4) \\[3ex] $ Option A. is the correct answer.
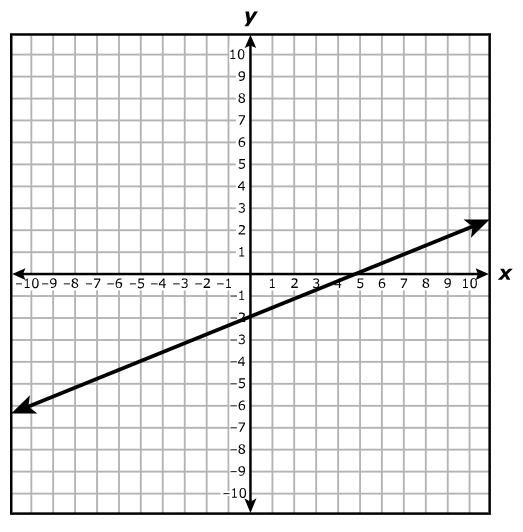
Which ordered pair is in the solution set of $2x - 5y \ge 10$?
$ A.\;\; (0, 5) \\[3ex] B.\;\; (5, 0) \\[3ex] C.\;\; (-2, 5) \\[3ex] D.\;\; (-5, 2) \\[3ex] $
There are at least two approaches to solving this question.
Use any approach you prefer.
1st Approach: Algebraic Solution
This involves checking each option to see the one that satisfies the inequality.
$ 2x - 5y \ge 10 \\[5ex] \text{Option A.} \\[3ex] (0, 5) \\[3ex] x = 0 \\[3ex] y = 5 \\[3ex] 2(0) - 5(5) \stackrel{?}{\ge} 10 \\[3ex] 0 - 25 \stackrel{?}{\ge} 10 \\[3ex] -25 \ngeq 10 \\[3ex] \text{Discard}. \\[5ex] \text{Option B.} \\[3ex] (5, 0) \\[3ex] x = 5 \\[3ex] y = 0 \\[3ex] 2(5) - 5(0) \stackrel{?}{\ge} 10 \\[3ex] 10 - 0 \stackrel{?}{\ge} 10 \\[3ex] 10 = 10 \\[3ex] 10 \ge 10 \\[3ex] \text{This is the correct answer}. \\[5ex] \text{Option C.} \\[3ex] (-2, 5) \\[3ex] x = -2 \\[3ex] y = 5 \\[3ex] 2(-2) - 5(5) \stackrel{?}{\ge} 10 \\[3ex] -4 - 25 \stackrel{?}{\ge} 10 \\[3ex] -29 \ngeq 10 \\[3ex] \text{Discard}. \\[5ex] \text{Option D.} \\[3ex] (-5, 2) \\[3ex] x = -5 \\[3ex] y = 2 \\[3ex] 2(-5) - 5(2) \stackrel{?}{\ge} 10 \\[3ex] -10 - 10 \stackrel{?}{\ge} 10 \\[3ex] -20 \ngeq 10 \\[3ex] \text{Discard}. \\[3ex] $ 2nd Approach: Graphical Solution
They gave us a graph, so apparently, they want us to graph the inequality and use that graph in determining the solution.
Because the inequality contains an equal sign, the line will be a solid line.
$ 2x - 5y \ge 10 \\[5ex] \text{When } x = 0 \\[3ex] 2(0) - 5y \ge 10 \\[3ex] 0 - 5y \ge 10 \\[3ex] y \le \dfrac{10}{-5} ...\text{Division by a negative} \\[5ex] y \le -2 ...\text{Point } (0, -2) \\[3ex] \text{The shaded area is downwards from } y = -2 \\[5ex] \text{When } y = 0 \\[3ex] 2x - 5(0) \ge 10 \\[3ex] 2x - 0 \ge 10 \\[3ex] x \ge \dfrac{10}{2} \\[5ex] x \ge 5 ...\text{Point } (5, 0) \\[3ex] \text{The shaded area is to the right of } x = 5 \\[3ex] $ The graph of the inequality is:
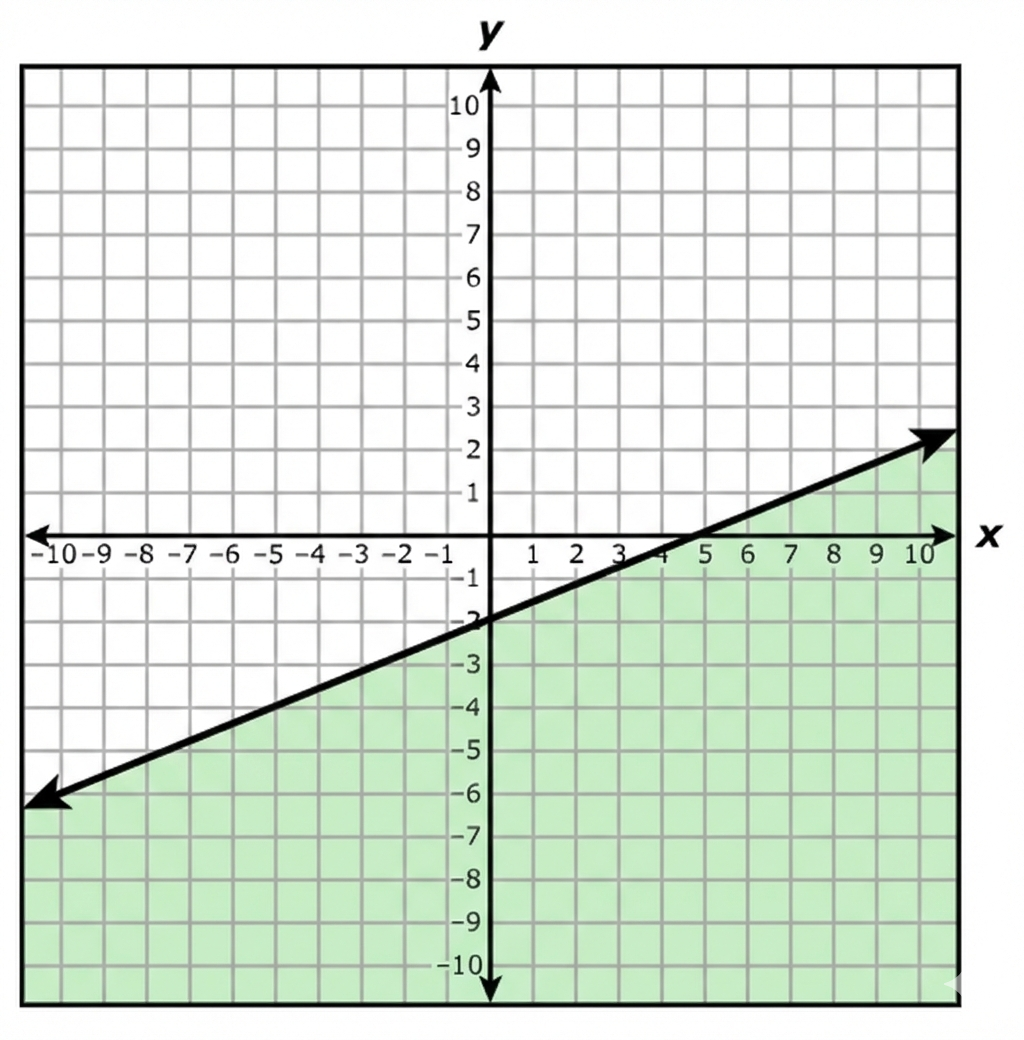
An ordered pair in the shaded region is in the solution set of the inequality.
Let us analyze each option.
Option A.
$(0, 5)$ is outside the shaded region.
Discard.
Option B.
$(5, 0)$ is on the solid line.
Because of the equality sign, it is inside the solution set. This is the correct answer.
However, let us analyze the remaining options if you wish.
Option C.
$(-2, 5)$ is outside the shaded region.
Discard.
Option D.
$(-5, 2)$ is outside the shaded region.
Discard.
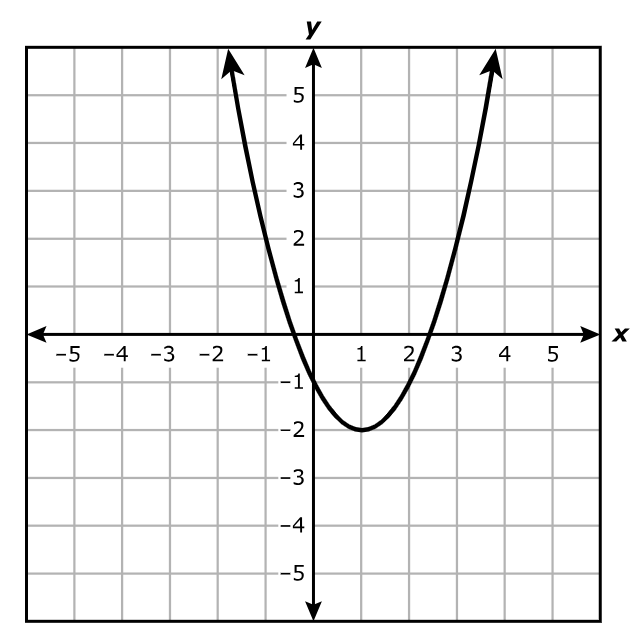
Which coordinates best represent the vertex of the graph?
$ A.\;\; (2.4, 0) \\[3ex] B.\;\; (0, -1) \\[3ex] C.\;\; (-0.4, 0) \\[3ex] D.\;\; (1, -2) \\[3ex] $
The vertex is the minimum point on the parabola.
The coordinates of the vertex is (1, –2)
A.
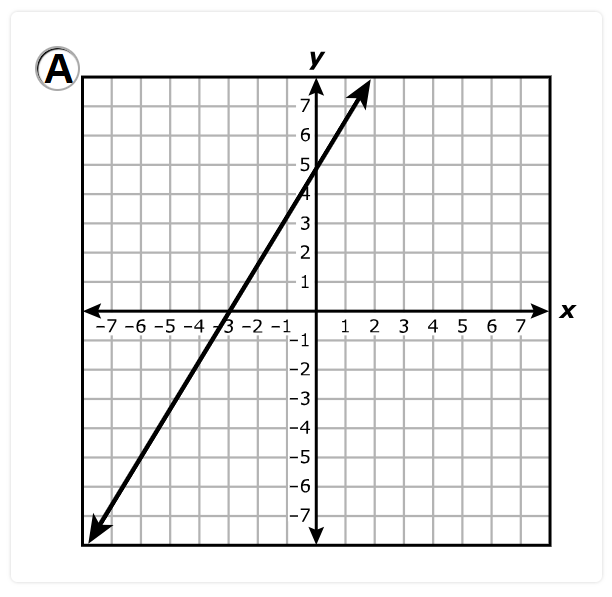
B.
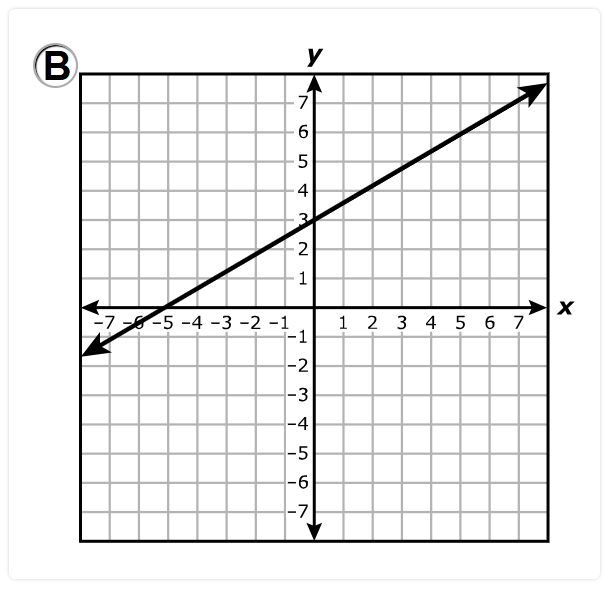
C.
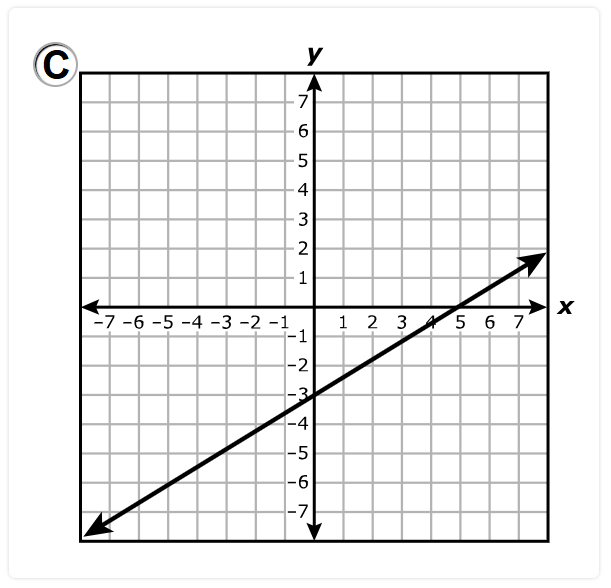
D.
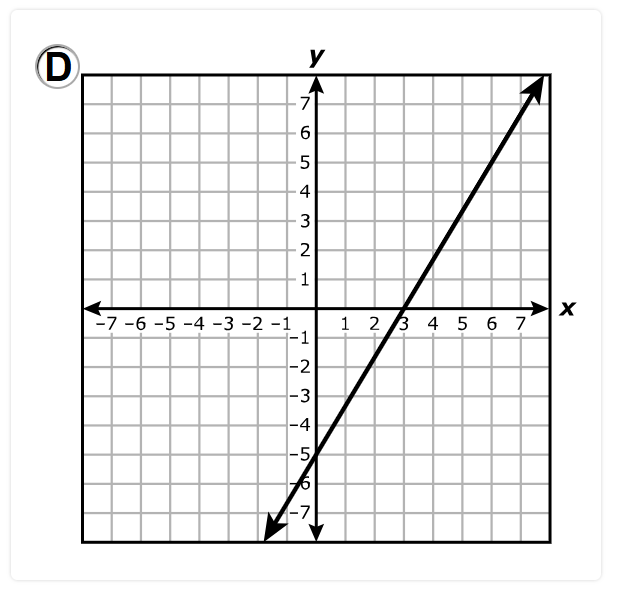
Let us analyze each option.
Option A.
x-intercept is (–3, 0)
y-intercept is (0, 5)
Discard.
Option B.
x-intercept is (–5, 0)
y-intercept is (0, 3)
This is the correct answer.
Option C.
x-intercept is (5, 0)
y-intercept is (0, –3)
Discard.
Option D.
x-intercept is (3, 0)
y-intercept is (0, –5)
Discard.
